

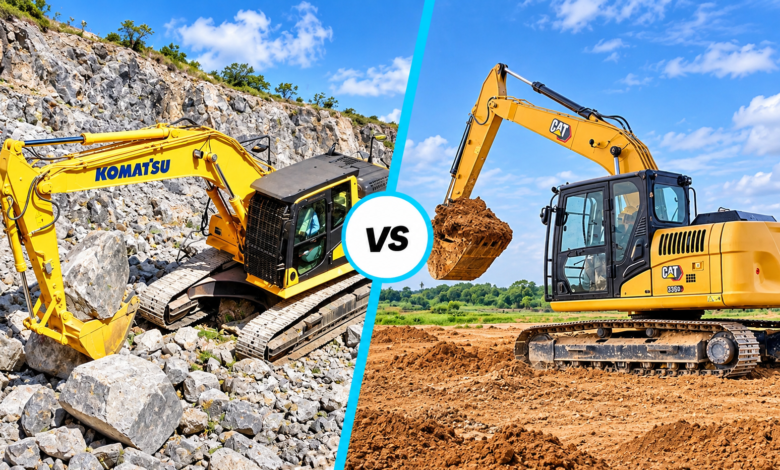
Caterpillar vs Komatsu: 7 Critical Differences for Smarter Choices
Caterpillar vs Komatsu pits the world’s largest construction equipment manufacturer, with USD 37.5 billion in 2025 construction equipment sales and a record USD 78.1 billion order backlog, against the number two, with approximately USD 27.1 billion and 11 percent of global sales. Seven differences separate them: scale, distribution model, African support, fuel claims, technology, resale and application fit. Neither brand holds an independently verified fuel or resale advantage, so dealer response time at the job site decides most purchases. This guide compares both brands using 2025 ranking data, Caterpillar’s third-quarter 2026 results, and published network data for engineers, investors, and fleet buyers.
Technical Snapshot: Core Brand Specifications
| Parameter | Detail |
| Brands compared | Caterpillar (United States) and Komatsu (Japan) |
| 2025 global rank | Caterpillar first; Komatsu second |
| 2025 construction equipment sales | Caterpillar USD 37.5 billion; Komatsu approximately USD 27.1 billion |
| Share of global sales | Caterpillar 15.2%; Komatsu 11.0% |
| Caterpillar Q3 2026 results | USD 20.7 billion in sales and revenues (up 17%); USD 78.1 billion record backlog |
| Distribution model | Caterpillar: independent dealers; Komatsu: 207 distributors in 152 countries plus direct subsidiaries |
| Africa footprint | Caterpillar: 14 dealers with 165 branches; Komatsu: 18 distributors plus 3 under other subsidiaries |
| Kenya partners | Mantrac Kenya (Caterpillar); Panafrican Equipment Kenya (Komatsu) |
| Fuel claims, 20-tonne class | Caterpillar Next Gen: up to 25% below previous series; Komatsu PC210LCi-11: up to 7% below predecessor |
| Autonomous haulage | Komatsu: 1,000 ultra-class trucks commissioned (April 2026); Caterpillar: 3 billion tonnes hauled (May 2021) |
| Binding constraint | Missing like-for-like fuel and resale data |
| Fastest lever | A 50-hour logged site trial of both machines |
| Benchmark metric | Cost per productive hour, including downtime |
| Ownership and structure shift | Tariff costs: Caterpillar approximately USD 2.2 billion in 2026; Komatsu JPY 37.8 billion a year |
Choosing between Caterpillar and Komatsu is a service-network decision first and a specification decision second. The seven differences below are ranked by their effect on cost per productive hour.
Introduction: Caterpillar vs Komatsu in Construction Equipment
Caterpillar vs Komatsu is the comparison at the top of the global construction equipment ranking, and the stakes reach well beyond a brochure. The two manufacturers hold first and second place, together sell approximately USD 64.6 billion in construction equipment annually, and compete head-to-head in every serious market from Nairobi to Nevada. The ranking of the leading construction equipment manufacturers places both well ahead of the chasing pack, so neither brand fails on quality; the real decision sits in service, cost and resale.
Cat vs Komatsu specification sheets for a 20-tonne excavator look almost identical, so buyers often rely on claims that rarely withstand scrutiny. Fuel-savings quotes for each maker’s previous model circulate, resale premiums circulate without sources, and dealer coverage shrinks to a branch count. Risk concentrates in three places: unplanned downtime while a part is in transit, fuel burn over 10,000 hours, and the price a machine fetches in year five. Tariffs and order backlogs add a fourth layer for investors and policymakers.
This guide compares seven differences using 2025 Yellow Table sales, Caterpillar’s third-quarter 2026 results, Komatsu’s published network data, and manufacturer specifications, and labels every vendor claim as such. Each section closes with a judgement, and the Technical Block section converts downtime and residual value into USD so engineers, investors, and fleet owners can apply a decision rule with numbers.
Difference 1: Scale and Financial Footing
Scale decides how long a manufacturer can fund parts stock, software and dealer support through a downturn. This section first covers the 2025 sales gap, then the 2026 order books, margins, and tariff costs that now separate the two balance sheets.
Market Share and the Sales Gap
Global construction equipment sales reached a record USD 246.6 billion in 2025, up 3.8 per cent, in the global ranking of equipment manufacturers by sales. Caterpillar leads Komatsu by approximately USD 10.4 billion, and the table below shows how far both stand ahead of the next two. Caterpillar’s USD 37.5 billion includes construction equipment sales; group revenue, including power systems and mining, reached USD 67.6 billion in 2025.
Global Ranking Snapshot: 2025 Construction Equipment Sales
| Manufacturer | 2025 rank | Sales (USD billion) | Global share |
| Caterpillar | 1 | 37.5 | 15.2% |
| Komatsu | 2 | Approx. 27.1 | 11.0% |
| XCMG | 3 | 14.2 | 5.8% |
| John Deere | 4 | 13.2 | 5.4% |
XCMG overtook John Deere to reach third place with approximately half of Komatsu’s sales. That scale now shapes price expectations across Africa, as evidenced by the range of XCMG models for African buyers.
Order Books, Margins and Tariff Exposure
Caterpillar’s 2026 third-quarter results show sales and revenues up 17 per cent to USD 20.7 billion and an adjusted operating margin of 20.6 per cent. The order backlog reached a record USD 78.1 billion, up USD 38.2 billion year on year, in the third-quarter CAT financial review. Construction Industries earned a 22.9 per cent segment margin on USD 8.0 billion of sales.
Tariffs cost Caterpillar approximately USD 600 million in the quarter and around USD 2.2 billion across 2026, excluding recoveries. Investors comparing Caterpillar and Komatsu as stocks find a sharper gap on the Japanese side: Komatsu imports about half of the products it sells in the United States, expects a tariff cost of JPY 37.8 billion (approximately USD 0.24 billion) a year, and guides operating income down 2.2 per cent and net income down 7.3 per cent in fiscal 2026. These figures date from September 2026.
Group scale gives Caterpillar room to absorb that cost: price realisation added USD 663 million to third-quarter revenue. Komatsu’s margin pressure does not threaten parts supply, but it narrows the room to discount against Chinese rivals. In the Caterpillar vs Komatsu financial comparison, the footing favours Caterpillar today, and, on current evidence, neither company poses counterparty risk for a five-year machine purchase.
Difference 2: Distribution Model
Both brands reach customers through local partners, yet the legal structures of those partners differ, and that structure shapes any Caterpillar vs Komatsu dealer network comparison. The first part covers Caterpillar’s independent dealer model; the second covers Komatsu’s mix of independent distributors and direct subsidiaries.
Caterpillar’s Independent Dealer Model
Caterpillar relies on independent, locally owned dealers and argues that private ownership accelerates investment decisions; Caterpillar’s century-long presence in Africa helps explain this reasoning. Barloworld Equipment became a Cat dealer in 1927, and the parent of Mantrac Kenya acquired its Kenyan dealership in 1924. Dealers carry inventory, run rebuild centres, and arrange financing through Cat Financial.
The structure has a clear advantage: a dealer-owner carries inventory risk personally, so parts availability tracks local profits. It also has a weakness: service quality can differ sharply between dealers, and a buyer in Kisumu can have a different experience from a buyer in Nairobi under the same badge.
Komatsu’s Distributor and Direct-Subsidiary Model
Komatsu’s worldwide operating locations span 207 sales and service distributors across 152 countries, 55 sales locations and 60 manufacturing sites, with 70 per cent of production overseas. In Africa, it combines independent distributors with direct subsidiaries: Komatsu South Africa in Germiston, Komatsu Customer Finance Africa and Komatsu Middle East in Dubai.
Direct subsidiaries give Komatsu tighter control of parts and training in southern Africa, while independent distributors carry the rest of the continent. Brands below the top two compete on the same service question. JCB, ranked ninth with USD 7.5 billion in 2025, earns African loyalty through buyer trust rather than size, as JCB’s standing with African buyers explains.
Difference 3: Africa and Kenya Support
Any Caterpillar vs Komatsu Africa comparison should start from network density near your site rather than network size. This section compares the continental footprint of each brand, then tests it in Kenya, where Mantrac Kenya and Panafrican Equipment Kenya compete for the same contractors.
Continental Footprint
The counts below are not like-for-like: Caterpillar reports dealer branches, while Komatsu reports distributors whose territories vary in size. Caterpillar’s retail construction equipment sales rose 16 per cent across Europe, Africa and the Middle East in the third quarter, so dealer capacity there faces rising demand.
Africa Support Network Comparison
| Metric | Caterpillar | Komatsu |
| Independent dealers or distributors | 14 dealers | 18 distributors, plus 3 under other subsidiaries |
| Branches | 165 | Continental total not published |
| Rebuild capacity | 22 Certified Rebuild Centres | Reman and rebuild centre, Johannesburg |
| Parts hubs | Distribution centre, Johannesburg | Parts centres, Johannesburg and Dubai |
| Technicians | Approximately 3,500 | Not published |
| Training | Technicians for Africa online programme (nearly 30 countries) | Training centres, Johannesburg and Dubai |
| Direct presence | None (all dealers independent) | Komatsu South Africa; Komatsu Customer Finance Africa |
Caterpillar publishes more granular African numbers, and Komatsu publishes fewer, so buyers should request the figures the public data omits. Chinese entrants broaden the question by quickly building networks, as SANY’s growing presence in Africa illustrates. Komatsu’s regional operations in Africa list the hubs that carry its parts and rebuild work.
Further Reading: SANY Construction Equipment in Africa: 7 Proven Wins and Honest Limits
Kenya: Mantrac Kenya vs Panafrican Equipment
Mantrac Kenya’s role in Kenya’s industry spans 100 years as Caterpillar’s sole authorised dealer in the country, dating back to its parent’s acquisition of Gailey & Roberts in 1924. Panafrican Equipment Kenya, the Komatsu distributor, opened a KES 500 million Nairobi headquarters on Mombasa Road in 2019, and the headquarters doubles as its East African base.
Headquarters size does not decide the Mantrac Kenya vs Panafrican Equipment comparison. A contractor on the Nairobi-to-Mombasa corridor needs parts on the shelf and a field technician within reach, so ask each dealer for 12 months of parts fill-rate data, the names of technicians near your site, and a written breakdown of response times. The dealer that supplies those figures in writing earns a place on the shortlist.
Difference 4: Fuel Efficiency and Operating Cost
Fuel is the cost line that every sales team cites in Caterpillar vs. Komatsu excavator comparisons, and few independent studies test it. The first part explains what each manufacturer’s fuel claim measures; the second turns fuel gaps into USD so buyers can price a claim before believing it.
What the Efficiency Claims Measure
Caterpillar’s next-generation excavators cut fuel use by 20 to 25 per cent compared with the previous series, lowered maintenance costs by up to 15 per cent, and extended the hydraulic return filter interval to 3,000 hours. Komatsu’s PC210LCi-11 excavator cuts fuel use by up to 7 per cent through new engine and hydraulic controls. Each figure compares a machine to its predecessor, so neither answers the Komatsu vs Caterpillar fuel-efficiency question.
Manufacturer Efficiency Claims for the 20-Tonne Class
| Claim | Caterpillar Next Generation 320 | Komatsu PC210LCi-11 |
| Fuel reduction | Up to 25% | Up to 7% |
| Comparison baseline | Previous Cat series | Previous Komatsu model |
| Maintenance cost | Up to 15% lower | Not published |
| Technology productivity gain | Up to 45% over traditional grading | Up to 63% over standard PC210LC-11 with stakes and grade checkers |
| Engine rating | Not stated | 165 HP gross; 158 HP net |
Rating basis causes a second error. Komatsu lists 165 horsepower gross and 158 horsepower net for the PC210LCi-11, and several competitor tables cite 165 horsepower gross against a Cat number without specifying the basis. Compare ISO net power on both sides, or the comparison inflates one brand’s advantage.
Pricing a Fuel Claim in USD
The planning case below assumes a 20-tonne excavator working 1,800 hours a year at 14 litres per hour with diesel at USD 1.40 per litre, which burns 25,200 litres and costs USD 35,280 annually. These figures are illustrative assumptions, not measurements; replace them with your own site data.
Annual and Five-Year Value of a Fuel Gap (Illustrative 20-Tonne Excavator)
| Fuel gap | Litres saved per year | USD per year | USD over 5 years |
| 5% | 1,260 | 1,764 | 8,820 |
| 7% | 1,764 | 2,470 | 12,348 |
| 10% | 2,520 | 3,528 | 17,640 |
| 25% | 6,300 | 8,820 | 44,100 |
A verified 7 per cent gap is worth USD 2,470 per year, which a single party’s delay can erase. The most reliable test is a logged trial: run both machines on the same dig with the same operator for 50 hours, and compare the telematics fuel data from Komtrax (standard on the PC210LCi-11) and Cat LINK.
Difference 5: Technology and Automation
Technology separates Caterpillar vs Komatsu less on excavators than on mining trucks. The first part compares excavator machine control; the second compares autonomous haulage, where the gap is measurable.
Excavator Machine Control
Komatsu’s intelligent machine control excavator debut introduced full 3D satellite guidance tied to the hydraulics, joystick-mounted controls, and a claimed 63 per cent efficiency gain over a standard PC210LC-11 working with stakes and grade checkers. Komatsu sells that capability as a distinct model, the “i” series, with the intelligent Machine Control 2.0 system factory integrated.
The Caterpillar takes a laddered route. Cat Grade 2D forms the base system, with upgrade paths to Advanced CAT grade excavators in 2D and 3D, alongside Grade with Assist, Payload Weighing, and E-Fence, E-Ceiling, and E-Wall limits, and Caterpillar claims up to 45 per cent better operating efficiency over traditional grading. Both approaches work. Komatsu’s integrated 3D suits fleets that grade every day; Caterpillar’s ladder suits contractors who want to pay only for features their operators will use. Operator uptake decides the payback, so test both with your own crews.
Autonomous Haulage in Mining
Komatsu commissioned its 1,000 autonomous ultra-class trucks by April 2026, and its FrontRunner customers have moved more than 11.5 billion tonnes since 2008. Caterpillar’s Cat Command hauling milestone of 5 billion tonnes came in September 2022 across 17 mine locations and nine customers, with retrofit kits available for other truck brands.
Autonomous Haulage Milestones
| Metric | Komatsu FrontRunner | Caterpillar Command |
| Start of commercial operation | 2008 | 2013 (first autonomous Cat trucks commissioned) |
| Latest milestone in the releases reviewed | 1,000 ultra-class trucks and 11.5 billion tonnes (April 2026) | 5 billion tonnes (Sept 2022) |
| Regions named | North America, South America, Australia, Europe | North America, South America, Australia (2021) |
| Truck classes | 930E-5AT ultra-class, 290-tonne payload | 190 to 360 tonne classes |
| Productivity claim | Not quantified in the release | Up to 30% higher productivity |
The companies report on different bases, truck count for Komatsu and cumulative tonnes for Caterpillar, so a fair comparison needs current figures from both. Neither release mentions an African deployment, so African miners should treat autonomy as a question of local dealer capability and ask each distributor that supports it on-site.
Difference 6: Resale Value and Total Cost of Ownership
In a Caterpillar vs Komatsu five-year model, resale and downtime often outweigh fuel. The first part examines what the used-market evidence shows; the second lists the cost lines that make up ownership.
What the Resale Evidence Shows
Neither manufacturer publishes a verified residual percentage, so the question of which holds value better, Caterpillar or Komatsu, rests on auction liquidity. Used equipment auction demand data from the first quarter of 2022 shows Caterpillar selling nearly three times as many excavators as the next brand and earning the highest median price in most categories. That evidence is American, dated, and not like-for-like, because machine capacities differ between brands.
Used Excavator and Dozer Auction Volumes, Q1 2022 (United States)
| Brand | Excavators sold | Dozers sold |
| Caterpillar | 370+ | 315+ |
| John Deere | 130+ | 75+ |
| Komatsu | 120+ | 55+ |
The Caterpillar vs Komatsu resale value premium is plausible because deeper liquidity supports the price, but no one has independently quantified it. Treat any claim of a fixed resale percentage as marketing and ask for a written buy-back quote instead.
Total Cost of Ownership Drivers
Caterpillar vs Komatsu total cost of ownership combines five lines: purchase price, fuel, maintenance, downtime, and residual value. Caterpillar documents service intervals of 3,000 hours for the hydraulic return filter and 1,000 hours for the air filter on its Next Gen machines. Komatsu’s PC210LCi-11 page lists a 400-litre fuel tank and a 234-litre hydraulic system but no comparable interval claim, so request the service schedule in writing.
Buyers who also weigh lower-priced Chinese machines should add Chinese versus Western equipment costs for the same model, because a lower purchase price can be reversed once downtime and residual value are factored into the sum.
Further Reading: Chinese vs Western Construction Equipment: 7 Hidden Costs, Smart Wins
Difference 7: Product Range and Application Fit
Range determines whether a single dealer can serve an entire project, and Cat vs. Komatsu differs more here than the headline specifications suggest. This section compares how much each group depends on construction equipment, then shows where Chinese and other brands put pressure on both incumbents.
Construction, Mining and Power Exposure
Caterpillar earns from three large segments. In the third quarter, Power & Energy produced USD 8.8 billion at a 24.4 per cent margin, Construction Industries produced USD 8.0 billion at a 22.9 per cent margin, and Resource Industries produced USD 4.6 billion at a 13.5 per cent margin. Power generation sales rose 30 per cent to USD 3.4 billion, coming mainly from turbines and large engines for data centres.
Komatsu concentrates on construction, mining, and utility equipment, where the aftermarket accounts for about half of sales and around two-thirds of mining revenue. A contractor who wants excavators and generator sets under one service contract therefore leans towards Caterpillar’s power systems business; a miner who values aftermarket depth leans towards Komatsu’s service model.
Where Chinese and Other Brands Press Both Incumbents
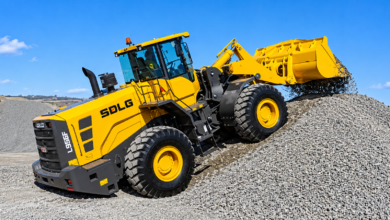
Challengers compete hardest in volume categories. Wheel loaders show the pattern, with price-led buyers weighing the case made by SDLG’s wheel loader appeal against a Cat or Komatsu loader backed by a dealer with deeper parts stock.
Application Fit Guide
| Application | Lean towards | Reason |
| Large mining haulage | Komatsu or Caterpillar | Both run autonomous systems; Komatsu reports the larger commissioned truck count |
| Mixed fleet with generator sets | Caterpillar | Power systems and machines under one dealer contract |
| Daily precision grading, 20-tonne class | Komatsu “i” model or Cat Grade 3D | Both factory-integrated machine control; operator uptake decides |
| Remote site with thin dealer coverage | Brand with the nearest parts counter | Downtime outweighs any specification gap |
Engineering Checks for Choosing Between Caterpillar and Komatsu
Four checks convert the seven differences between Caterpillar and Komatsu into a purchase decision. The first price is a parts wait; the second price is resale points; the third sets the evidence to demand from each dealer; and the conclusion states the decision rule.
1. Downtime Arithmetic: What a Parts Wait Costs
This case assumes 10 working hours per day and USD 60 in revenue per machine hour, both illustrative. A five-day parts wait costs USD 3,000, equal to a full year of an 8.5 per cent fuel advantage that neither brand has demonstrated.
Cost of a Parts Wait on a 20-Tonne Excavator (Illustrative)
| Wait length | Lost hours | Lost revenue (USD) | Equivalent sustained fuel gap |
| 2 working days | 20 | 1,200 | 3.4% |
| 5 working days | 50 | 3,000 | 8.5% |
| 10 working days | 100 | 6,000 | 17.0% |
2. Residual Value Arithmetic: What Resale Points Are Worth
On a USD 150,000 machine, each residual percentage point equals USD 1,500. A five-point gap after five years amounts to USD 7,500, which corresponds to a sustained 4.3 per cent fuel advantage over the same period.
Residual Value Points on a USD 150,000 Excavator (Illustrative)
| Residual gap after 5 years | Value (USD) | Equivalent sustained fuel gap over 5 years |
| 3 points | 4,500 | 2.6% |
| 5 points | 7,500 | 4.3% |
| 8 points | 12,000 | 6.8% |
3. Dealer Audit: Proof to Request in Writing
A dealer audit turns promises into evidence before money changes hands. The table lists what to request in a Mantrac Kenya vs. Pan-African Equipment comparison or from any other dealer on your shortlist.
Dealer Audit: Evidence to Request Before Signing
| Test | Evidence to request | Why it matters |
| Parts availability | Twelve months of fill-rate data for the 50 most-used wear parts on your model | Turns a parts wait into a measured risk |
| Response time | Written breakdown response commitment for your site | Sets downtime exposure |
| Technicians | Named field technicians and certifications within reach of your site | Tests real service depth |
| Fuel performance | A 50-hour telematics report from a comparable customer | Tests the fuel claim |
| Resale | Written five-year buy-back or residual quote | Locks the resale assumption |
| Financing | Quotes from Cat Financial or Komatsu’s finance arm | Includes cost of capital in the model |
Conclusion: Caterpillar vs Komatsu Comes Down to Service Proof
The Caterpillar vs Komatsu verdict favours Caterpillar on three of the seven differences, Komatsu on one, and leaves three split or unproven. Caterpillar wins on scale and financial footing (USD 10.4 billion ahead of Komatsu, with a USD 78.1 billion backlog), on African network depth (14 dealers with 165 branches) and on resale liquidity. Komatsu wins on technology, with 1,000 autonomous trucks commissioned and integrated excavator machine control. The distribution model, fuel efficiency, and application fit remain split or unproven because every published fuel figure compares a machine to its predecessor. Caterpillar is the lower-risk default for most African contractors; Komatsu is the better choice wherever its distributor sits closer to your site.
The decision rule is simple. Choose the brand whose nearest dealer commits in writing to ship a wear part within two working days, because a five-day wait costs USD 3,000 on a 20-tonne machine, the annual value of an 8.5 per cent fuel advantage nobody has verified. Treat any fuel claim above 7 per cent as marketing until a 50-hour logged trial confirms it, and secure a written five-year buy-back quote before signing. Run both brands through the Technical Block checks, then buy from the dealer that passes.
Get Smarter Equipment Decisions Before You Buy
Follow Construction Frontier: Equipment Brands & Manufacturers for brand comparisons, dealer network analysis, fleet cost models, and Africa-focused buying guidance that help engineers, investors, and project teams choose equipment with evidence rather than brochures.

One Comment