BRT Financing Models in Africa: 5 Effective Funding Strategies for Successful Bus Rapid Transit
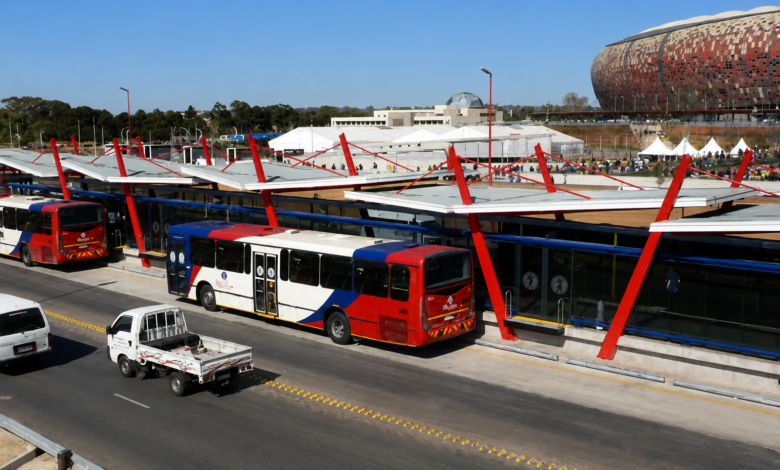
African cities fund Bus Rapid Transit (BRT) through a blend of national budgets, multilateral loans, concessional donor grants, and private concession capital, because farebox revenue alone rarely covers more than 30-40% of operating costs. Dakar’s BRT corridor drew on a USD 300 million World Bank credit, an €80 million European Investment Bank loan, and a private concessionaire that mobilised USD 150 million in equity and debt. Lagos took a leaner route in 2008, delivering Africa’s first BRT scheme for a fraction of the USD 6 million per kilometre benchmark set by Bogotá’s TransMilenio. The five BRT financing models examined here determine whether a corridor becomes a durable public asset or a stalled liability.
Technical Snapshot: BRT Financing Benchmarks
| Metric | Value |
| Typical capital cost, full-specification BRT | USD 4 million to USD 6 million per kilometre |
| Typical capital cost, BRT-Lite corridor | USD 1 million to USD 2 million per kilometre |
| Average African farebox recovery ratio | 30 percent to 40 percent of the direct operating cost |
| Dakar BRT total project cost (post-restructuring) | approximately USD 614 million |
| Dar es Salaam DART Phase 1 cost | EUR 134 million for 21 kilometres |
| AfDB loan for DART Phase 2 | USD 141.71 million |
| Cape Town MyCiTi farebox recovery | just over 40 percent |
Getting BRT financing models right in Africa is now the difference between a corridor that operates for decades and one of the many that stall mid-construction once donor disbursements slow or government budgets tighten.
Introduction: Financing Bus Rapid Transit in Africa
Bus Rapid Transit is sold to African mayors as the affordable alternative to metro rail, and on a cost-per-passenger basis, it usually is. But affordable does not mean self-financing. Every operational BRT corridor on the continent, from Lagos to Cape Town, has needed a layered capital stack combining sovereign borrowing, donor concessional debt, and increasingly private concession finance, precisely because the gridlock strangling road networks across the region has become too costly to ignore.
Understanding how BRT projects are funded matters more than understanding how they are built because Bus Rapid Transit funding structures determine whether a corridor survives currency depreciation, fare-affordability politics, and construction delays that routinely run into years. This article breaks down the five BRT financing models African cities are using and where each tends to fail.
Capital Cost Structures for BRT Projects
BRT capital costs are split into two categories: fixed infrastructure, which governments or donors typically fund, and rolling stock, which is increasingly funded by private operators. Weighed against the GDP drag that idle traffic imposes on regional economies, even a heavily leveraged corridor is usually the cheaper option, but cities that blur the infrastructure-fleet distinction, treating the corridor as one undifferentiated capital bill, tend to produce BRT financing packages that neither donors nor private lenders want to touch.
Infrastructure vs Fleet Costs
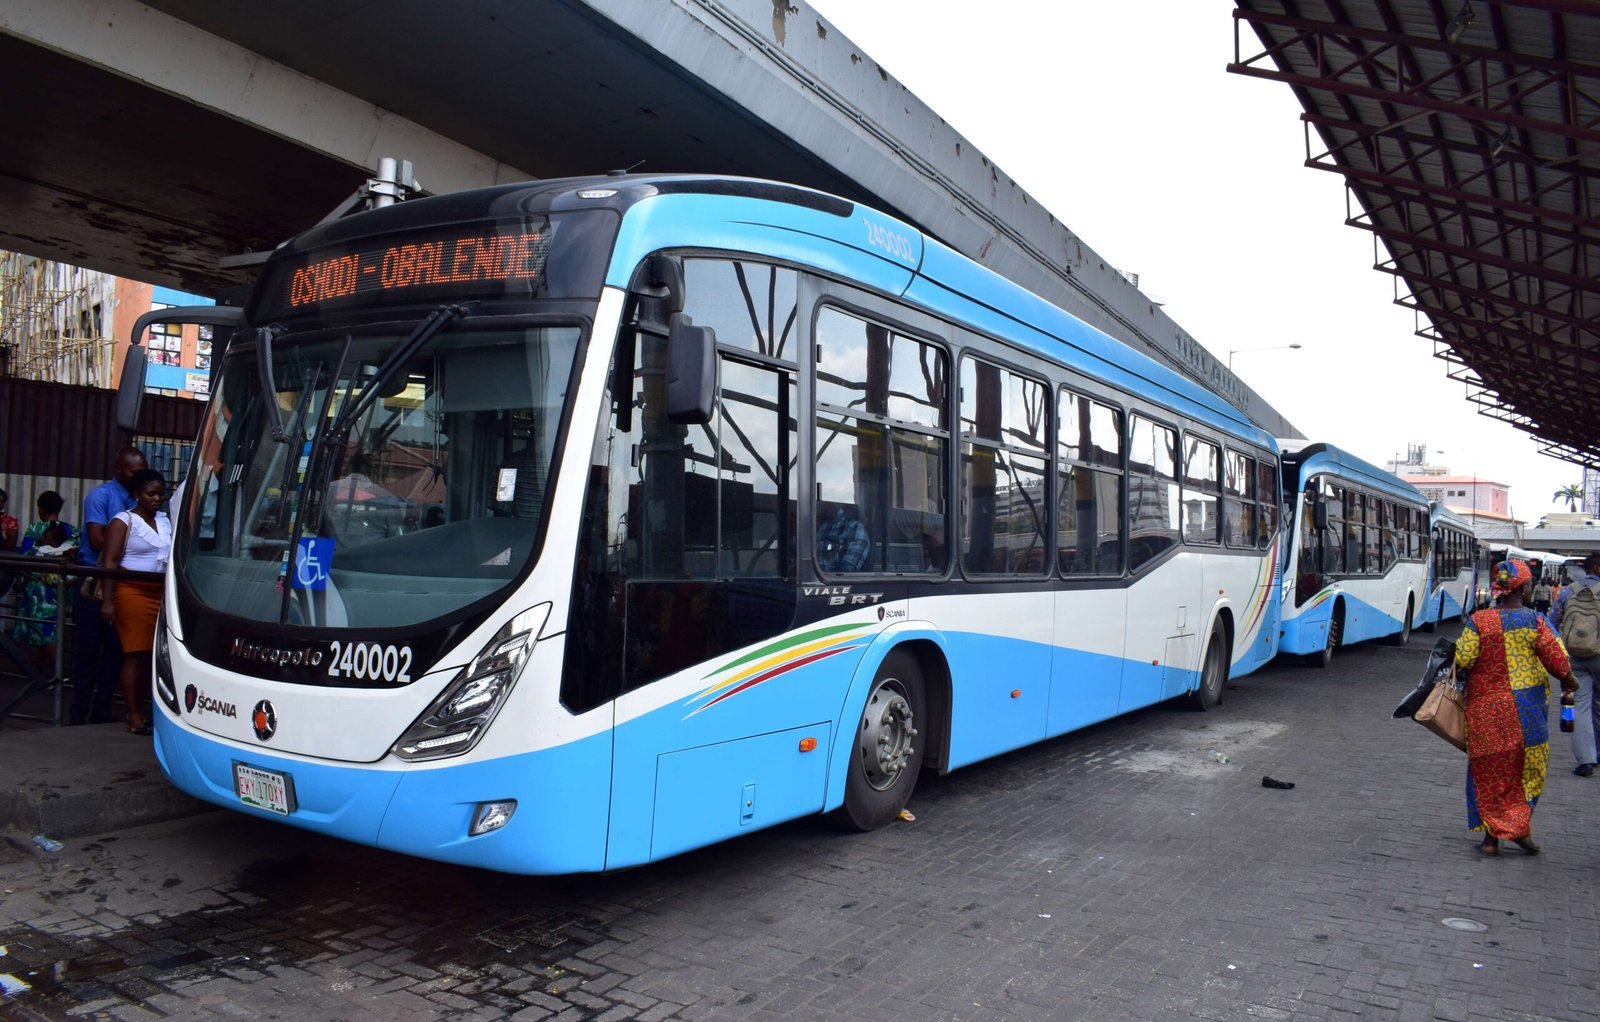
Civil infrastructure, dedicated lanes, stations, terminals, depots, and signal upgrades generally consume 60 to 75 percent of the total project cost and are where public and donor capital concentrates. Lagos deliberately built a lighter-specification corridor well below the full-specification benchmark set by systems like TransMilenio, proving that the scope of infrastructure drives most of the cost variation across African BRT projects.
Fleet procurement, by contrast, is where private capital increasingly enters: the state government spent roughly NGN 4.5 billion on infrastructure, while a private operator financed its initial 100-bus fleet through a NGN 1 billion Ecobank facility, a lending pattern that echoes how contractors in Africa structure equipment purchases once bank credit becomes the default route to heavy assets.
Public Funding Sources
Public money remains the base layer of nearly every African BRT financing structure, even when donors and private partners cover most of the bill, because government contributions signal the fiscal commitment lenders require before disbursing. Two channels dominate these Bus Rapid Transit funding structures: direct budget allocation and, far less commonly, municipal debt instruments.
National Government Budget Allocation
National and state treasuries typically fund land acquisition, resettlement compensation, and a counterpart contribution alongside donor credits. Senegal’s government covered a substantial share of the Dakar corridor’s ballooning resettlement costs, requesting that IDA credit funds cover the balance once expenses threatened the timeline. In Lagos, direct state infrastructure spending on the pilot corridor helped push transport-sector investment up fiftyfold once the pilot proved credible, a modest early outlay unlocking far larger donor and private capital later, a pattern that recurs across nearly every case study of how African cities fund Bus Rapid Transit projects.
Municipal Bond Financing
Municipal bonds remain the least developed of the five BRT financing models. African municipalities generally lack the credit ratings or bond market depth to issue infrastructure debt at scale, unlike Bogotá or Curitiba, where sub-national debt markets helped seed early BRT capital. South African metros come closest, but even Johannesburg and Cape Town rely overwhelmingly on national grants rather than bond issuance. Until African municipal bond markets mature, this funding gap in African BRT projects continues to push capital-raising responsibility upward to treasuries and multilateral lenders.
Donor and Multilateral Financing
Multilateral development banks provide the largest share of donor funding for public transport in Africa, and their involvement often determines whether a project reaches financial close. Two channels matter most: direct transport-sector lending and climate-linked instruments.
World Bank and AfDB Transport Programmes
World Bank financing for BRT in Africa began with the Lagos Urban Transport Project, a USD 50 million IDA credit in 2007 that funded Africa’s first BRT scheme, later topped up by a second phase co-financed with the French Development Agency. In Dar es Salaam, the second phase drew just over USD 141 million from the pan-African development lender in 2015, while a separate World Bank package brought the wider Central Transport Corridor Project to roughly USD 290 million. Dakar’s original IDA credit of USD 300 million, later supplemented after cost overruns reached nearly USD 188 million, shows how routinely these packages get restructured mid-construction rather than cancelled.
Climate Financing Mechanisms
Climate finance has become a new layer in BRT financing models that Africa is testing, particularly in cities that commit to electric fleets. Dakar’s decision to operate a fully electric 120-bus fleet drew Green Climate Fund co-financing alongside its World Bank and EIB credits, justified by projected annual savings of roughly 39,000 tonnes of CO₂-equivalent emissions over the corridor’s lifetime. This route works because electrification adds a cost that ordinary transport-sector loans are not designed to cover, and climate funds target that incremental cost specifically. More African cities are expected to structure future corridors around blended climate and transport instruments as electrification becomes standard.
Public-Private Partnership Models
PPP financing for BRT has shifted from a theoretical model to operating reality, most visibly in Dakar, where the entire operations and fleet layer now sits with a private concessionaire rather than a state transport agency. This section covers how those concessions are structured and how risk gets divided under the strongest public-private partnership models for BRT now running on the continent.
Concession Structures for Operations
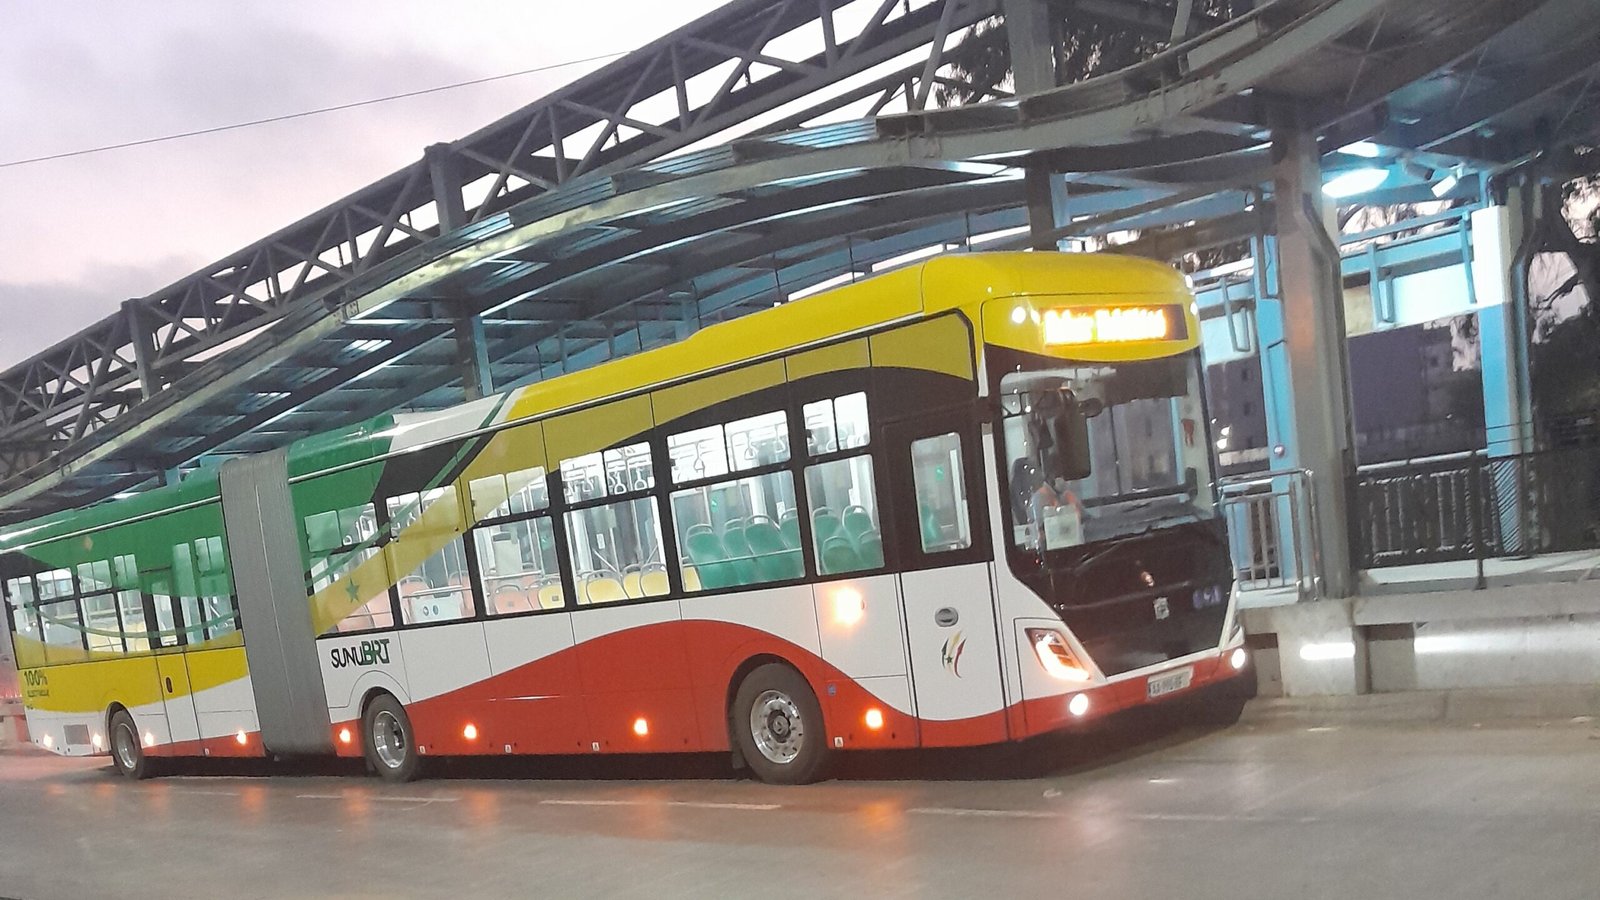
Dakar Mobilité SA, backed by the infrastructure investor Meridiam, signed a concession agreement with Senegal’s Executive Council of Urban Transport in March 2022 covering fleet acquisition and the operation and maintenance of 120 electric buses and 23 stations, mobilising roughly USD 150 million in private investment, while infrastructure ownership stayed with the public authority.
Lagos and Dar es Salaam ran lighter versions of the same split: public agencies built and owned civil infrastructure, while selected operators, First BRT Cooperative Limited and a roughly USD 40.9 million consortium, respectively, took on fleet procurement and day-to-day operations. Across all three, the government retains the corridor, and the private partner absorbs fleet capital and operating risk.
Risk Allocation Between Public and Private Partners
Getting this allocation wrong is what kills BRT concessions after financial close, not before it. Political risk insurers such as the Multilateral Investment Guarantee Agency (MIGA) now cover concessionaires against expropriation and contract breach, a signal that private investors in African BRT financing view sovereign and currency risk as the binding constraint, not construction risk.
Fare-setting is the second flashpoint: Dakar’s concession had to balance an initially proposed flat fare against what officials judged socially acceptable, since operator revenue depends on fare levels, and governments face pressure to keep fares low. Cities that skip a fare-adjustment mechanism before signing are more likely to renegotiate mid-operation, thereby raising the cost of capital in subsequent tenders. Even a well-structured term sheet cannot paper over the informal-operator pushback and institutional weakness that have derailed BRT concessions in Africa, which is why lenders now price political risk alongside financial risk.
Further Reading: BRT Governance in Africa: 5 Political Barriers to Project Success
Revenue and Cost Recovery
No African BRT system covers its full capital and operating costs from fares, which means cost-recovery models for Bus Rapid Transit have to look beyond the farebox to remain viable. Two mechanisms matter here: fare revenue itself, and the land value that transit corridors generate but rarely capture.
Farebox Recovery Ratios
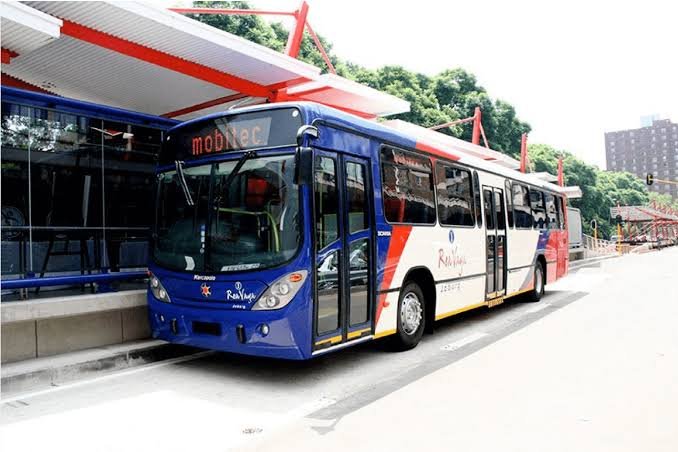
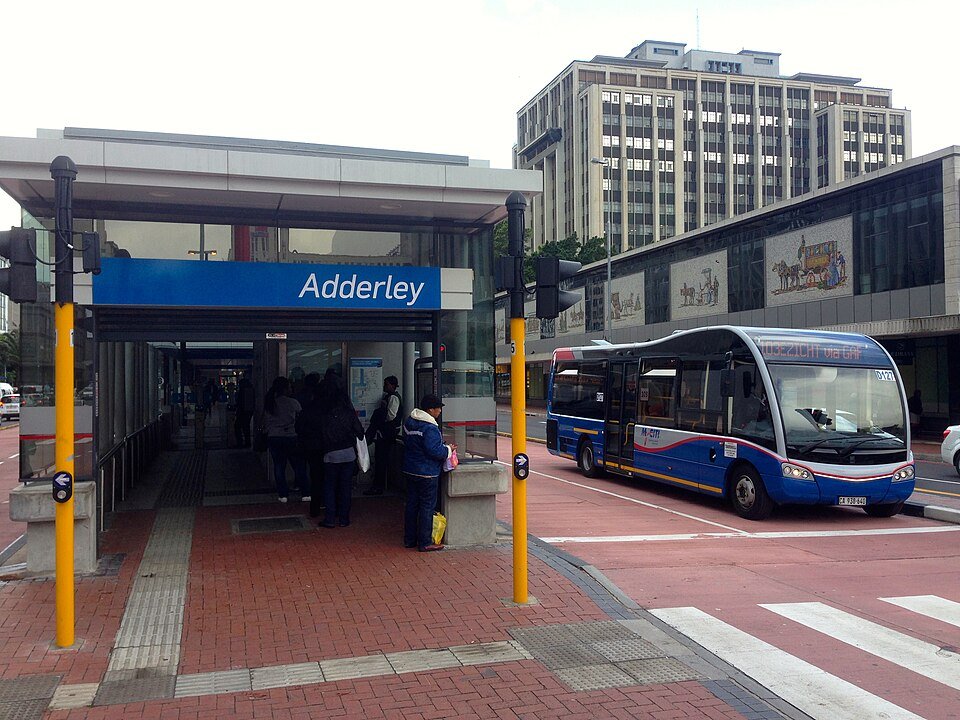
Farebox recovery figures for BRT in South Africa illustrate the gap between planning assumptions and operating reality. Johannesburg’s Rea Vaya recovers only around 30 percent of its direct operating costs from fares, while Cape Town’s MyCiTi recovers just over 40 percent, still short of the near-total recovery achieved by the Latin American systems that inspired both designs. The shortfall traces largely to ridership density: Rea Vaya’s daily boardings per kilometre of busway sit well below comparable systems abroad, a reflection of commuters who still default to a private car or minibus taxi rather than switch modes, not fare-collection failure, and both cities have had to subsidise their systems far more heavily than originally planned.
Land Value Capture Around Corridors
Land value capture offers cities a funding stream entirely outside the farebox, and Ethiopia has gone furthest in testing it. Addis Ababa’s urban land lease system allows the municipality to auction publicly owned land at benchmark prices that rise as infrastructure investment raises surrounding property values, enabling the city to recover part of the value its own spending creates.
The mechanism works best where transit-oriented densification is planned alongside the corridor, which is why cities that plan their busway and rail lines as a single connected network tend to have an easier time structuring them than those retrofitting them later. Few other African cities have formal instruments yet, and rising land values along several planned corridors suggest the opportunity is being left on the table.
BRT Financing Structures Compared
Placing the three most documented case studies side by side shows how differently the same funding models get weighted by fiscal capacity, credit access, and appetite for private concessions.
Funding Mix by Case Study City
| City | Public Budget | Multilateral Debt | Climate Finance | Private/PPP Capital |
| Dakar | Resettlement and counterpart funding | World Bank IDA USD 300m, EIB €80m | Green Climate Fund co-financing | Meridiam-backed concession, ~USD 150m mobilised |
| Lagos | LASG infrastructure spend, LAMATA institutional funding | World Bank IDA USD 150m across two phases, AFD USD 100m | Not applied at the pilot stage | Ecobank fleet loan to private operator |
| Dar es Salaam | Government of Tanzania land and counterpart funds | AfDB USD 141.71m, World Bank additional financing to ~USD 290m | Limited in the initial phases | ~USD 40.9m PPP operations structure |
Cost per Kilometre Benchmarks
Bogotá’s TransMilenio remains the global reference point against which other systems are measured, including Nairobi’s own planned Colombia-inspired corridor, whose financing structure is still being worked out.
| System Type | Approximate Cost per Kilometre | Representative Example |
| Full-specification BRT (dedicated infrastructure, high-capacity stations) | USD 4m–USD 6m | TransMilenio (Bogotá), South East Busway (Brisbane) |
| BRT-Lite (partial segregation, lighter civil works) | USD 1m–USD 2m | Lagos Mile 12–CMS corridor |
| Electrified BRT with resettlement and fleet costs bundled | USD 20m+ | Dakar corridor (total project basis, including overruns) |
Further Reading: Nairobi BRT Plan: 5 Proven Lessons from Colombia’s TransMilenio Model
Conclusion: Building Bankable BRT Projects
The five BRT financing models covered here, from public budget allocation, municipal debt, multilateral lending, PPP concessions, and revenue-based cost recovery, are not competing alternatives. Every operating African BRT system uses at least three simultaneously, layered so public money absorbs the highest-risk early-stage costs, donor capital covers most infrastructure, and private concessionaires take on fleet and operating risk once ridership and fares are reasonably certain. Cities that shortcut this sequencing, seeking concession finance before political consensus on fares exists, are the ones whose corridors stall mid-construction.
The more useful lesson from Dakar, Lagos, and Dar es Salaam is that the BRT financing models Africa should copy going forward are structured for cost recovery from day one, not retrofitted after ridership disappoints. Farebox recovery ratios of 30 to 40 percent are not a failure to hide; they are a planning input that should shape how much public subsidy a system locks in before construction starts, and how aggressively it pursues complementary revenue like land value capture. Cities entering their first BRT financing round with that discipline build corridors that survive their first decade.
Finance Smarter Bus Rapid Transit Systems
Explore more technical transport infrastructure analyses, BRT planning reviews, and urban mobility deep dives on Construction Frontier: Urban Infrastructure & Transportation Systems, where transit financing models, project delivery, sustainable transport, and proven infrastructure strategies are examined through practical civil engineering insight.