Traffic Congestion Economics: 5 Critical Ways Urban Gridlock Hurts GDP
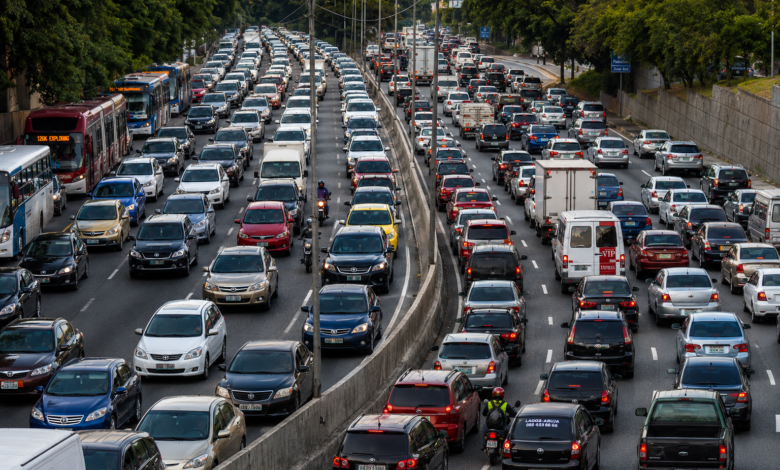
Traffic congestion economics measures how idle engines, wasted fuel, and stalled commutes translate into lost national output. In Nairobi, gridlock strips out approximately 1.79% of Kenya’s GDP every year, while Lagos loses an estimated ₦4 trillion annually to the same problem. Across sub-Saharan Africa, logistics costs run at 15% to 20% of GDP, roughly double the United States benchmark, because congested corridors slow freight as much as they slow commuters. The pattern is consistent: every hour lost in traffic is an hour subtracted from productive economic activity.
Technical Snapshot: Congestion Cost Benchmarks
| Metric | Value |
| Nairobi’s Annual Congestion Cost | Approximately USD 1 billion in lost productivity |
| Kenya’s GDP Loss to Congestion | 1.79% of national GDP |
| Lagos’s Annual Congestion Cost | ₦4 trillion in lost productivity, fuel, and vehicle wear |
| Sub-Saharan Africa Logistics Cost Share of GDP | 15%–20%, against 8% in the United States |
| Africa’s Annual Infrastructure Investment | Approximately 4% of GDP |
These figures reposition traffic congestion economics from a commuter grievance into a measurable drag on national output, one that finance ministries and investors are increasingly forced to price into growth forecasts.
Introduction: The Economics of Traffic Congestion
Engineers have spent decades treating congestion as a design failure: too few lanes, poor signal timing, unmanaged intersections. Economists read the same gridlock differently. To them, a stalled highway is a stalled production line, and the delay compounds every time a truck misses a delivery window or a worker arrives late to a shift. Traffic congestion economics exists precisely to close that gap, converting hours lost in traffic into currency lost from GDP.
The discipline matters more in African cities than almost anywhere else because vehicle ownership is rising faster than road capacity, a dynamic explored in depth in the analysis of the structural causes of Africa’s traffic failure. Understanding traffic congestion and economic growth in Africa requires isolating the economic mechanics: how the economic cost of traffic congestion is measured, how it erodes GDP sector by sector, how it shapes where capital chooses to land, and what the return on transport investment actually looks like once the numbers are run.
Measuring the Cost of Congestion
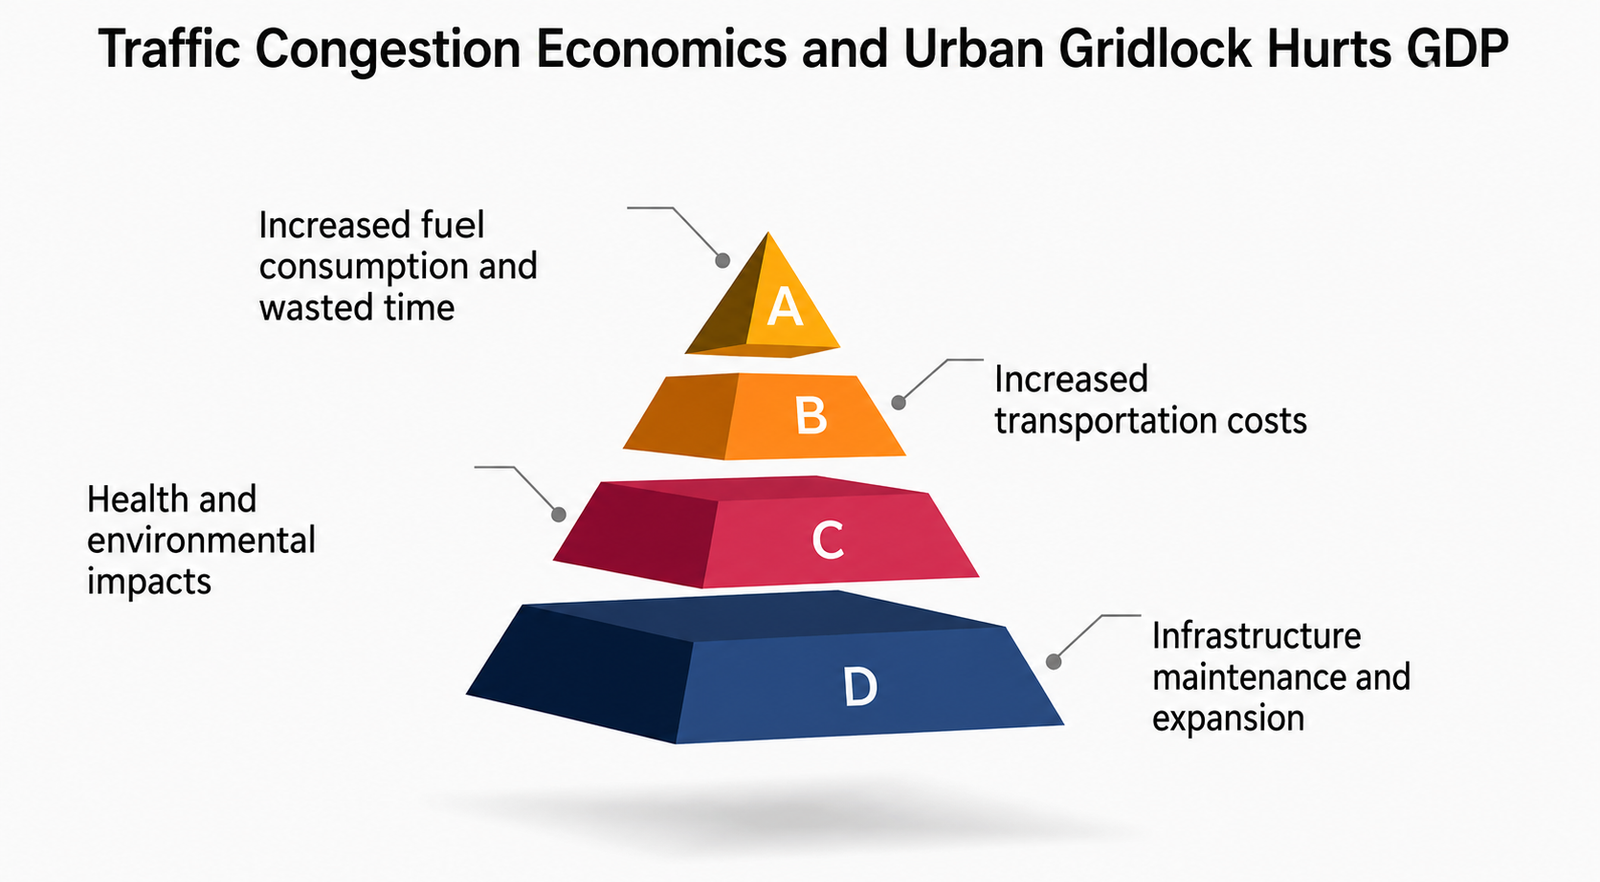
Before the impact of congestion on GDP in Africa can be modelled at the national level, analysts need a reliable city-level unit of measurement. Measuring the economic impact of congestion starts with two cost categories that dominate every credible study: the value of time lost to delay and the direct operating expense of running a vehicle in stop-start traffic. Both are calculable, both are large, and both feed directly into the broader economic cost of traffic congestion.
Lost Productivity Hours
Time is the largest line item in any congestion audit, and urban gridlock productivity loss is where traffic congestion economics begins. Nairobi commuters lose an average of 57 minutes per trip during peak hours, and when that delay is multiplied across the metropolitan workforce, the resulting productivity loss amounts to nearly USD 1 billion a year, according to a transport authority assessment that ranks Nairobi among the world’s most congested cities.
A separate econometric study of Nairobi’s road network put the annual value of delay-related wastage at Ksh 146.5 billion, a figure drawn from regression modelling of motorists’ willingness to pay for decongestion. Lagos illustrates how traffic congestion affects national GDP at a different scale. Commuters there lose an average of 2.21 hours daily to traffic, and when that time is valued at average wages, the productivity losses from traffic congestion amount to an estimated ₦4 trillion a year, a figure confirmed by Lagos State’s own transport advisory office.
Fuel and Vehicle Operating Costs
Stop-start driving burns fuel at a rate that free-flowing traffic never approaches, and that inefficiency shows up directly on balance sheets. Idling engines, repeated braking, and low-gear crawling raise fuel consumption per kilometre well above rated efficiency, while constant deceleration accelerates wear on brakes, clutches, and suspension components.
In Lagos, this operating cost burden climbs into the tens of billions of naira in additional fuel spending and vehicle maintenance annually, part of the wider cost of traffic jams to the economy that fleet operators absorb before it reaches consumers as higher fares and delivered prices. The pattern repeats in every gridlocked African capital: matatu owners and logistics firms carry operating costs that simply would not exist on an uncongested network.
Congestion’s Impact on National GDP
Once city-level costs are established, the next step in traffic congestion economics is aggregating them into a national picture. The impact of congestion on GDP in Africa is not evenly distributed across the economy; it concentrates in sectors that depend on the predictable movement of people and goods, and it compounds through freight corridors long before it reaches a factory gate or a retail shelf.
Sector-Level Productivity Losses
Service and manufacturing sectors absorb the sharpest productivity losses from traffic congestion, because both depend on staff and inputs arriving on schedule. Small and medium enterprises are especially exposed: a Nairobi County study of SMEs found that motor vehicle congestion measurably affects financial performance through late deliveries, missed client meetings, and reduced working hours.
At the national level, Kenya’s road congestion is estimated to cost the economy 1.79% of GDP, a figure drawn from survey research on Nairobi’s urban transport patterns, a clear marker that traffic congestion and economic growth in Africa are moving in opposite directions. Nigeria’s exposure is larger in absolute terms: one assessment places Lagos’s annual GDP loss from lost commuting hours at ₦10.39 trillion, equivalent to approximately USD 22.5 billion, based on an analysis of productive hours lost to Lagos traffic. These are direct subtractions from national output that would otherwise fund wages, tax revenue, and reinvestment.
Logistics and Freight Cost Inflation
Congestion’s impact on GDP in Africa extends well beyond passenger delays to the cost of moving goods, where the economic impact is most visible. Logistics costs across many African economies run at 15% to 20% of GDP, climbing to 30% in landlocked or low-income states, compared with roughly 8% in the United States, according to World Bank analysis of logistics performance data. Congested urban corridors contribute directly to that gap, since freight in most African cities shares lanes with commuter traffic and has no dedicated truck routes or off-peak delivery windows.
The downstream effect reaches food security: a 2025 World Bank report found that 37% of locally produced food in sub-Saharan Africa is lost in transit, a consequence of slow processing, weak infrastructure, and inefficient supply corridors. Cement pricing shows the same mechanism at a materials level, where transport accounts for a substantial share of delivered construction costs once haulage distance and congestion are factored in, as detailed in the breakdown of logistics-driven price dispersion in Kenya’s cement market.
Congestion and Investment Climate
Congestion’s economic damage does not stop at productivity and freight costs; it also shapes where capital chooses to locate. Investors read commute times and corridor reliability as proxies for how efficiently a city can support operations, and that reading feeds directly into site selection and capital allocation decisions.
Business Location Decisions
Firms weighing where to open a distribution centre, a plant, or a regional headquarters price in commute reliability alongside land cost and utility access. A location with unpredictable travel times raises staffing risk and increases the cost of last-mile delivery. This is one reason businesses in Lagos and Nairobi increasingly cluster near expressways rather than traditional central business districts, mirroring the logic behind Kenya’s Nakuru-Eldoret corridor, projected to cut logistics costs along the route by up to 40%, according to a review of transformative transport projects reshaping Kenya’s investment landscape. That pull away from congested cores mirrors the broader tension explored in the assessment of why private vehicle dependency persists despite the availability of public transport alternatives.
Further Reading: Public Transport vs Private Vehicles: 4 Barriers to Shifting Mobility
Foreign Direct Investment Sensitivity
Foreign direct investment is measurably sensitive to the quality of transport infrastructure across the continent. Panel data research on African economies found a consistent, statistically significant positive relationship between paved road density and FDI inflows, with transport infrastructure standing out as one of the strongest predictors of investment attractiveness, according to research presented at the African Development Bank’s conference on infrastructure financing.
Congestion works against every one of those variables: a city that cannot move goods and staff reliably signals higher operating risk to investors, regardless of how favourable its tax regime appears. This is why planners increasingly frame congestion reduction as an economic policy, and why persistent logistics bottlenecks continue to be flagged in assessments of the factors that slow Africa’s infrastructure delivery.
Economic Case for Transport Investment
If congestion imposes a measurable cost, transport investment should generate a measurable return, and this is where traffic congestion economics moves from diagnosis to prescription. Mass transit projects and targeted road interventions each have distinct cost-benefit profiles, and comparing them head-to-head is the only way to justify capital allocation to finance ministries and multilateral lenders.
Return on Investment for Mass Transit
Nairobi’s own decongestion history offers a useful benchmark. Expansion of Thika Road and the launch of the Syokimau commuter rail service are estimated to have collectively saved motorists over Ksh 197 billion annually in reduced delays and wasted fuel, based on the same econometric assessment of Nairobi’s traffic congestion economics cited earlier.
Bus Rapid Transit corridors follow a comparable logic at a lower capital cost per passenger-kilometre than rail, which is why Nairobi’s own BRT rollout draws so heavily on lessons from Bogotá’s TransMilenio system. The return depends on how the project is funded and governed, covered in the cluster’s dedicated reviews of funding strategies for bus rapid transit across African cities and the political barriers that routinely stall BRT delivery.
Cost-Benefit Comparisons Across Interventions
Not every intervention delivers equal value per dollar invested. Rail and BRT trunk corridors generate the largest returns per unit of capital when they replace high-volume matatu or danfo routes because they remove the greatest number of vehicle-hours from congested lanes. Point interventions such as intersection redesign deliver faster but shallower returns, useful for immediate relief but insufficient at the metropolitan scale. The strongest outcomes come from combining modes rather than betting on one mode, an argument further developed in the cluster’s review of how cities sequence BRT and rail investments.
Further Reading: Integrated Urban Transport Planning: 4 Ways Cities Link BRT and Rail
Congestion Cost Benchmarks
Isolated figures are useful, but traffic congestion economics only becomes actionable once city-level data is set against international benchmarks. The economic cost of urban gridlock in Africa reads differently in isolation than it does when set alongside comparable OECD figures, so the table below presents both side by side.
GDP Loss Estimates by City
Table: Congestion Cost as a Share of Economic Output
| City/Country | Annual Congestion Cost | Share of GDP |
| Nairobi (Kenya) | ~USD 1 billion (productivity) | 1.79% |
| Lagos (Nigeria) | ~₦4 trillion (~USD 2.4 billion) | Not separately published |
| United States | USD 124 billion (2014), projected to be USD 186 billion by 2030 | ~0.7% |
| United Kingdom | USD 20.5 billion (2014), projected to be USD 33.4 billion by 2030 | Not separately published |
Comparative International Data
The scale gap between African and OECD congestion costs appears smaller in dollar terms than in structural terms. American and British commuters lose money mainly to time; African commuters and freight operators lose money to time, fuel, vehicle wear, and logistics inflation simultaneously because the underlying road networks are thinner and less redundant.
Global congestion is also trending upward rather than easing, with average travel speeds falling across most of the 500 cities tracked in the most recent worldwide mobility survey, confirming that congestion is worsening globally rather than stabilising. For African cities still building out primary transit networks, that trend removes any argument for delay.
Conclusion: Congestion as an Economic Policy Issue
Traffic congestion economics ultimately answers a question finance ministries can no longer avoid: Is it cheaper to build transit capacity now or to keep absorbing GDP losses indefinitely? The Nairobi and Lagos figures above show that the second option is not neutral. It is an ongoing transfer of national output into idling engines and missed working hours, one that compounds as vehicle ownership rises faster than road and rail capacity.
The evidence also points toward a specific policy response rather than a general one. Mass transit corridors, freight-dedicated routes, and integrated planning between BRT and rail consistently outperform piecemeal road widening on a cost-per-productivity-hour-recovered basis. Governments that treat congestion reduction as GDP protection, not just commuter convenience, are the ones most likely to secure the financing and political durability needed to see transit projects through to completion.
Understand the Economics Behind Urban Congestion
Explore more technical transport infrastructure analyses, urban mobility reviews, and infrastructure economics deep dives on Construction Frontier: Urban Infrastructure & Transportation Systems, where traffic congestion, transport investment, economic productivity, and proven strategies for building more efficient cities are examined through practical civil engineering insight.