Cement Manufacturing in Africa: 8 Powerful Strategies Driving Market Growth
Cement manufacturing in Africa now runs on eight strategies: new plant construction, vertical integration, alternative fuels, blended cements, cross-border consolidation, local raw materials, process automation and logistics optimisation. The continent operates approximately 441 million tonnes of annual cement capacity and holds 42% of the capacity under construction worldwide, with Nigeria, Egypt, Kenya, Ghana, and Mozambique leading. Producers that pair scale with low clinker content, affordable energy and short delivery routes earn the margin, while those that only add kilns inherit idle capacity.
Technical Snapshot: Core Strategy Specifications
| Specification | Detail |
| Strategy count | Eight: new plant construction, vertical integration, alternative fuels, blended cements, cross-border consolidation, local raw materials, process automation, logistics |
| Capacity impact | 441 Mtpa operating (8% of global); 43.3 Mtpa under construction (42% of the world’s pipeline); 23 Mtpa announced; approximately 507 Mtpa if every project completes |
| Timeframe | 2025 to 2030 build-out: Dangote Cement targets 80 Mtpa by 2030, up from 55 Mtpa. |
| Lead markets | Nigeria (11 projects, 23.6 Mtpa contracted), Egypt (88 Mtpa installed), Kenya, Ghana, Ethiopia, Mozambique, Tanzania |
| Binding constraint | Utilisation: Nigeria’s 60-65 Mtpa of capacity serves 25-30 Mt of demand; Ethiopia’s Lemi plant ran at 67%. |
| Fastest margin levers | Clinker self-sufficiency and clinker substitution (limestone and calcined clay blends) |
| Energy benchmark | Kiln heat of 3.6 GJ per tonne of clinker; Dangote’s thermal substitution near 9%, targeting 25% by 2030 |
| Ownership shift | Holcim exits Nigeria, Kenya, Uganda and Tanzania; Huaxin and Amsons acquire |
Cement manufacturing in Africa rewards the producer who controls clinker costs, energy prices, and delivered prices, and the eight strategies below show how the leaders do so.
Introduction: Cement Manufacturing in Africa
Cement manufacturing in Africa has moved from import shortages to the world’s most active kiln-building programme. Nigeria exported its way out of dependence, Kenya taxed its way towards clinker self-sufficiency, and Ghana commissioned the largest calcined clay plant on earth. Behind each move sits a producer rethinking how it earns margin, which is why the cement industry across Africa now deserves a strategy-level reading rather than a plant-by-plant list.
The scale explains the urgency. Africa operates approximately 441 million tonnes of annual capacity, equal to 8% of the global total, with another 43.3 million tonnes under construction and 23 million tonnes announced. That pipeline represents 42% of all capacity being built worldwide, and the drivers of regional cement demand, from urbanisation to corridor infrastructure, keep order books full. Cement capacity expansion in Africa now outpaces that of every other region.
Volume alone no longer decides outcomes. Nigeria’s installed capacity of 60 to 65 million tonnes meets only 25 to 30 million tonnes of consumption. This article sets out eight strategies for cement manufacturing in Africa that separate profitable growth from stranded capacity, backs each with 2025 and 2026 deal data, and closes with the engineering mechanics that make the numbers work. Each African cement manufacturer’s strategy below is tested against that gap.
Capacity Expansion Through New Plant Construction
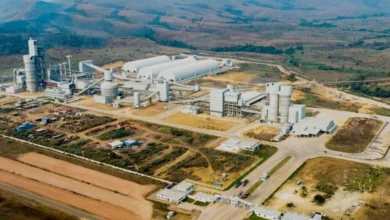
New kilns remain the most visible strategy because construction demand continues to pull capacity forward. The order books of Africa’s largest construction companies show where concrete will be poured over the next decade, and cement producers are building to meet that demand. This section covers where cement plant expansion in Africa is concentrated, which projects are underway, and where utilisation risk lies. These are the strategies driving plant-level growth in cement manufacturing in Africa.
Cement Plant Expansion in Africa: Where the Pipeline Sits
Contract awards show the build-out clustering in a handful of markets. Of 138 new plant contracts awarded between July 2025 and June 2026, 44% sat in the Middle East and Africa. Nigeria led the African list with 11 projects, and its 23.6 million tonnes of contracted capacity exceeds the combined 20.35 million tonnes of Libya, Egypt and Algeria.
Africa Plant Contracts by Country, July 2025 to June 2026
| Country | Projects | Contracted capacity (Mtpa) |
| Nigeria | 11 | 23.6 |
| Libya | 2 | 9.1 |
| Egypt | 4 | 6.25 |
| Algeria | 3 | 5.0 |
| Tanzania | 3 | 4.9 |
| Kenya | 3 | 4.5 |
Libya’s two projects average 4.55 million tonnes each, the largest unit size on the list, which signals single-site megaplants rather than regional networks. Tanzania and Kenya spread 9.4 million tonnes across six projects, an average of approximately 1.6 million tonnes, the scale that regional producers can finance without Dangote’s balance sheet. Those averages show how cement manufacturers are expanding in Africa: a few giant sites in some markets and many mid-sized lines in others.
Egypt shows the other end of the cycle. It holds Africa’s largest installed base, at approximately 88 million tonnes, so its four new projects extend an established base rather than open a new market. Producers in mature markets build for efficiency, while producers in Nigeria, Mozambique and Zimbabwe build for volume, and the two groups should not be compared on the same return metric. Cement capacity expansion in Africa, therefore, carries different returns by market.
Flagship Projects Under Way in 2026
The projects behind those contract numbers share one design habit: every kiln arrives with an energy plan. BUA ties its new Sokoto line to a dedicated power plant; Shuntai in Zimbabwe pairs a 2.2 million-tonne plant with a 50 MW solar array; and Bamburi designs alternative fuels into its Matuga clinker line. Sinoma CBMI holds the engineering contract on both the BUA and Bamburi projects, so one Chinese contractor now supplies kilns to rival producers on opposite sides of the continent. Cement manufacturing capacity expansion in Africa, therefore, starts with energy, not the kiln.
Selected Plant Projects Under Way in 2026
| Company | Market | Project | Capacity | Status and value |
| BUA Cement | Nigeria | Sokoto Line 6 with power plant | 3 Mtpa cement | USD 240 million; 20-month build from January 2026 |
| Dangote Cement | Nigeria | Itori, Ogun State (clinker hub first) | 6 Mtpa | Commissioning target 2027 |
| Dangote Cement | Côte d’Ivoire | Grinding plant | 3 Mtpa | Commissioned 2025 |
| Bamburi Cement (Amsons) | Kenya | Matuga clinker plant | 1.6 Mtpa clinker | USD 250 million; EPC signed December 2025 |
| Devki Group | Kenya | Kitui Plant, Mwingi North | 3 Mtpa cement | USD 385 million; operations due June 2027 |
| Cimentos de Moçambique (Huaxin) | Mozambique | Nacala expansion | 1.2 Mtpa after tripling | USD 110 million; completed July 2026 |
| Shuntai Investments | Zimbabwe | Chegutu integrated plant | 2.2 Mtpa | 50 MW captive solar; launch scheduled for September 2026 |
Cement Capacity Expansion in Africa: Where Utilisation Breaks
Capacity outruns demand in several African markets, and the gap decides which projects earn a return. Ethiopia’s Lemi plant, commissioned in September 2024 with a capacity of nearly 5 million tonnes, ran at approximately 67% utilisation in the first half of 2026, while Ghana’s central bank data showed cement sales falling 12.7% over the first five months of the year.
Kenya has 12 to 13 million tonnes of installed capacity against consumption of 7 to 8 million tonnes, a utilisation range of 55 to 70%, which Kenya’s cement market growth outlook follows through 2030. Nigeria’s surplus finds an outlet abroad: Dangote’s cement and clinker exports rose 62.3% to 1.1 million tonnes in the first half of 2026.
Cement manufacturing in Africa pays only for capacity, where a producer holds one of three advantages: an export outlet for surplus, captive clinker, or a corridor no rival can reach. BUA’s Sokoto line fits the third, because it serves Nigeria’s north-west and landlocked neighbours such as Niger and Benin from the region’s only cement plant. Investors judge cement manufacturing investment strategies in Africa by that test.
Further Reading: Cement Industry in Africa: Complete Guide to Markets, Manufacturing and Growth
Vertical Integration Across the Supply Chain
Integration decides who keeps the margin when prices fall in cement manufacturing in Africa. A producer that owns its clinker, power, and delivery routes absorbs shocks that cripple a grinding-only rival. The sections below follow clinker self-sufficiency in Kenya and the integration tiers that now structure African cement production. An African cement manufacturer’s strategy, built on integration, prioritises margin.
Clinker Self-Sufficiency: Kenya as the Test Case
Kenya introduced a 17.5% levy on imported clinker in July 2023, and clinker imports fell from 148,000 tonnes that year to 10,300 tonnes in 2024. The trade ministry has since dropped its plan to repeal the levy, citing higher local clinker output. Cemtech’s Sebit plant in West Pokot, commissioned in April 2024 at 6,000 tonnes per day, supplied the capacity that made the policy credible.
The economics favoured the policy. An independent verification committee found locally produced clinker 30% cheaper than imports from Egypt and Tanzania. Amsons responded by buying Bamburi, lifting its holding to approximately 96.5%, and committing USD 250 million to a 1.6 million-tonne clinker line that will raise Bamburi’s clinker capacity from 1.0 to 2.6 million tonnes. Kenya’s leading cement producers now split into integrated groups, and importers are racing to catch up. Amsons also shows cement industry consolidation in Africa paired with vertical integration. Cement manufacturing capacity expansion in Africa now follows each government’s clinker policy.
Integration also changes bargaining power. A producer with captive clinker can supply independent grinders, set the clinker price and decide who survives a downturn. That leverage explains why Devki’s clinker capacity, which the group planned to sell to Uganda, Rwanda and Burundi, worries importers more than its cement brand does. Such pricing power shapes growth in cement manufacturing in Africa more than headline capacity does.
Integration Tiers in African Cement Production
Four operating models now coexist, and each carries a different risk profile. The table separates them by what the producer controls and what it leaves exposed.
Integration Models in African Cement Manufacturing
| Model | Example | Advantage | Exposure |
| Fully integrated (quarry, kiln, power, fleet) | Dangote Nigeria, 35.25 Mtpa | Lowest delivered cost near limestone | Gas and diesel prices; heavy capex |
| Integrated with captive clinker for its own grinders | Dangote clinker to Ghana and Cameroon | Keeps kilns full; feeds coastal grinding plants | Vessel availability; border taxes |
| Newly integrating | Bamburi, Matuga | Replaces imported clinker; saves foreign exchange | Build risk; clinker 2.6 Mtpa against cement 4.0 Mtpa |
| Grinding-only | Rai, Savannah and Ndovu in Kenya | Low capex; fast to market | Import levy; currency swings |
Dangote’s second tier deserves attention. The group shipped 34 clinker cargoes from Nigeria to Ghana and Cameroon in 2025, which turned a national kiln surplus into feedstock for foreign grinding plants. Integration here crosses borders, and it explains why Dangote’s pan-African volumes grew 19% in the first half of 2026 even as segment margin slipped to 17.6%. Cross-border clinker supply extends cement plant expansion in Africa without new kilns at the destination.
Alternative Fuel and Energy Diversification
The kiln sets the cost curve for cement manufacturing in Africa. Global kilns burn approximately 3.6 gigajoules per tonne of clinker, and thermal energy accounts for 35% of cement emissions. African producers address that cost in two ways: by replacing fossil fuels with alternative fuels in the kiln and by generating their own power. These cement production strategies in Africa now appear in almost every new plant specification. Both feed sustainable cement manufacturing in Africa.
Alternative Fuels in African Cement Manufacturing
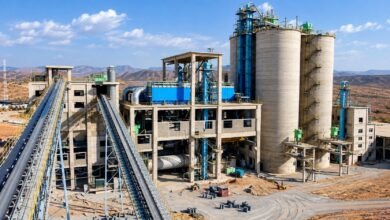
Precalciners tolerate lumpier, wetter fuel than the main burner, which is why most waste fuel enters there; the quarry-to-bag manufacturing stages explain where that step sits in the line. Dangote’s thermal substitution rate stands near 9% and targets 25% by 2030, using agricultural, industrial and municipal waste. The group has already co-processed over 437,000 tonnes of waste as fuel. Alternative fuels in African cement manufacturing now supply a measurable share of kiln heat.
Coastal and agricultural markets have a local advantage in husks and shells. Bamburi’s Matuga design uses coconut husks, cashew shells and municipal solid waste from Kenya’s coast, while Cimpor’s Kribi plant in Cameroon burns cocoa and cashew shells and runs on hydropower. The Kribi plant cut emissions per tonne by 40% by combining those fuels with calcined clay. Local biomass supply decides where cement manufacturing capacity expansion in Africa can run on waste fuel.
Alternative Fuel and Energy Projects Across Africa
| Project | Fuel or energy source | Stated effect |
| Dangote Cement Group | Municipal, industrial and agricultural waste | Substitution near 9% now; 25% target by 2030 |
| Bamburi Matuga, Kenya | Coconut husks, cashew shells, municipal waste | Built into a 1.6 Mtpa clinker line |
| Cimpor Kribi, Cameroon | Cocoa and cashew shells; hydropower | 40% lower emissions per tonne |
| Shuntai Chegutu, Zimbabwe | 50 MW captive solar; electric vehicle fleet | 2.2 Mtpa plant, launch scheduled for September 2026 |
| Huaxin Simuma, South Africa | 9 MW waste heat recovery | New kiln and 1 Mtpa cement mill |
| BUA Sokoto Line 6, Nigeria | Dedicated power plant; Kogi LNG supply | 3 Mtpa line |
Cost is the real driver, not compliance. Fuel is the highest variable cost in clinker, and every percentage point of waste fuel replaces purchased coal or gas. Producers that secure waste streams early also lock in supply contracts with municipalities and farmers, creating a local moat that a late entrant cannot quickly replicate. Cement manufacturing growth in Africa, therefore, favours the plant with the best fuel logistics, not only the best kiln. The African cement manufacturer’s strategy for fuel is therefore as much a procurement strategy as an engineering one.
Captive Power and Waste-Heat Recovery
Grid power in many African markets is unreliable, so producers build their own. Dangote expanded gas supply agreements with the national gas marketing and infrastructure companies, and BUA plans to power Sokoto from its Kogi LNG plant at Ajaokuta. Each arrangement trades grid risk for fuel-price risk, a trade that favours producers with a gas source near the plant. Energy planning now shapes every cement plant expansion in Africa.
Waste-heat recovery adds a second layer to cement manufacturing in Africa. It converts kiln exhaust and cooler air into electricity, so the plant burns no extra fuel for that power. Huaxin’s 9 MW unit in South Africa shows the template, and solar arrays such as Shuntai’s 50 MW system cover daytime loads. The strongest designs combine all three, because each source covers a different hour of the kiln’s demand. Both show how cement manufacturers are expanding in Africa while managing energy costs.
Blended and Low-Carbon Cement Adoption
Clinker accounts for the cost and carbon in cement manufacturing in Africa. Calcination alone produces 53% of cement’s emissions, so replacing clinker beats almost every other lever per dollar spent. Three routes dominate African practice: limestone blends, calcined clay and conventional supplementary materials. Together, they define sustainable cement manufacturing in Africa. These cement production strategies in Africa differ mainly in capex.
Sustainable cement manufacturing in Africa begins with arithmetic, not new technology. Every tonne of clinker avoided removes both its fuel and its process emissions, and blending needs only a mill and a standard. The route is therefore open to grinding-only plants that cannot afford a kiln. Blending enables cement manufacturing capacity expansion in Africa to occur at grinding stations.
Portland Limestone Cement: The Quiet Majority
Blending is already the norm in Africa’s largest cement manufacturing market. Nigeria’s open market sells Portland limestone cement under the CEM II class of NIS 444-1, with 6 to 35% limestone, while CEM I is available mainly in bulk from the factory. Contractors comparing OPC and PPC cement should note that the bag in front of them is usually already a blend. That is how cement manufacturers are expanding in Africa without building kilns.
Calcined Clay: From Pilot to Plant
Ghana turned calcined clay into an industrial product. CBI Ghana, backed by Heidelberg Materials, commissioned a 1,200-tonne-per-day flash calciner at Tema in March 2026, the largest of its kind, with a capacity of over 400,000 tonnes per year. The CBI Ghana USD 110 million plant targets a clinker import bill of nearly USD 500 million per year, and the calciner is designed to replace 30 to 40% of clinker in the final blend.
Standards came first. Ghana had no national specification for this cement when CBI began scaling production, so the standards work preceded the plant. Kenya sits earlier on the curve: a Meru University laboratory is testing LC3 with minimal modifications to existing lines, while Nigeria has abundant clay, and no comparable plant has been announced. That sequencing is the template for sustainable cement manufacturing in Africa.
Clinker Substitution Routes in African Cement Manufacturing
| Route | Typical clinker replacement | African example | Main constraint |
| Limestone (CEM II) | 6 to 35% limestone | Nigerian producers | Limestone purity; early strength |
| Calcined clay (LC3) | 30 to 40% in CBI’s design | CBI Ghana; Cimpor Kribi | Kaolinitic clay; calciner capex; national standard |
| Fly ash, slag, natural pozzolana | Grade-dependent under CEM II | Kenyan blended grades | Thin ash and slag supply where coal power and steel are small |
The same logic extends to supplementary cementitious material choices, which suit coastal grinding stations without kilns. Fly ash and slag need coal power and steel mills nearby, so coastal and clay-rich markets favour calcined clay instead.
Standards set the pace of adoption. A producer cannot sell a new blend to public works clients until a national specification names it, which is why green cement’s impact in Africa depends on standards bodies moving as fast as plant builders. Engineers specifying low-carbon cement for infrastructure should confirm the grade appears in the national standard before approving it. Standards, therefore, hinder the growth of low-carbon cement manufacturing in Africa.
Cross-Border Consolidation and M&A
Ownership in cement manufacturing in Africa is changing faster than capacity. Western multinationals have sold most of their African cement assets, and Asian and regional buyers have taken them. This section covers the retreat, the buyers and the competition risk. Cement industry consolidation in Africa follows the multinationals’ exit.
The Multinational Retreat
Holcim agreed in November 2023 to sell Uganda’s Hima Cement and its 65% stake in Tanzania’s Mbeya Cement, then sold Bamburi and Lafarge Africa in 2024 and 2025. The exits follow Holcim’s focus on higher-return markets. Cement industry consolidation in Africa began with those sales.
African Cement Transactions Reshaping Ownership, 2021 to 2025
| Seller | Buyer | Asset | Terms |
| Lafarge/Holcim | Huaxin Cement | Lafarge Zambia (75%) and Malawi | USD 150 million for Zambia, 2021 |
| Holcim | Sarrai Group | Hima Cement, Uganda | Enterprise value: USD 120 million |
| Holcim | Amsons Group | Mbeya Cement, Tanzania | 65% stake |
| Holcim | Amsons Group | Bamburi Cement, Kenya | 58.6% stake; Amsons reached approximately 96.5%. |
| Holcim | Huaxin Cement | Lafarge Africa, Nigeria (now HBM Nigeria) | 83.81%; USD 1 billion equity value; completed August 2025 |
Cement Industry Consolidation in Africa: The Asian and Regional Buyers
Chinese producers invested in nine new African cement projects in 2023 and five in 2024, with Huaxin leading the way. The Nigerian purchase gave Huaxin four integrated plants and 10.6 million tonnes of capacity. West China Cement reported higher selling prices and margins at its African plants than at its plants in China, which justifies the expansion.
Regional groups buy too. Amsons holds about 68.7% of East African Portland Cement through linked entities, so the Tanzanian group now controls two of Kenya’s best-known producers. Africa’s leading cement brands, therefore, are owned by different owners than they were in 2022.
The pattern mirrors the consolidation strategies among construction leaders worldwide: buyers pay for installed kilns and market share, then invest in upgrades. Africa differs in one respect, because buyers can also acquire the clinker position that new entrants would need years to build. It also shows how cement manufacturers are expanding in Africa through ownership rather than greenfield sites.
Further Reading: Top 10 Cement Brands in Africa: Elite Industry Leaders
How Cement Manufacturers Are Expanding in Africa: Three Entry Routes
Buyers use three routes. They acquire an operating producer, as Huaxin did in Nigeria; they upgrade a tired plant, as Huaxin did at Nacala in Mozambique, where the kiln revamp reached ignition in 12 months; or they build greenfield, as Amsons did at Matuga. Acquisition is fastest but costs the most per tonne. Brownfield upgrades add capacity cheaply, and greenfield suits producers that need a clinker position. Any African cement manufacturer’s entry strategy starts with choosing among them.
Huaxin’s pipeline shows the mix. It upgraded Zambia’s Chilanga kiln in 2025, advanced a 2,000-tonne-per-day clinker line in Malawi, and tripled Nacala’s capacity to 1.2 million tonnes in July 2026. Dugongo is building a 2.2-million-tonne plant in the same port city, adding a local rival. Cement plant expansion in Africa now often means upgrading an old line rather than clearing new land. Each step is a cement capacity expansion in Africa without a new site.
Competition and Concentration Risk
Consolidation raises integration returns but also regulatory heat. Three producers hold more than 90% of Nigeria’s installed capacity, and Dangote alone commands approximately 60% of the Nigerian market. Regulators in Nigeria and Kenya will scrutinise any further buyout among the top three, so acquirers should expect remedies rather than clean approvals. Consolidation is one of several cement production strategies in Africa that regulators watch closely. Cement manufacturing investment strategies in Africa must price in that regulatory risk.
Localisation of Raw Material Sourcing
Limestone is used as a raw material in most African cement manufacturing sites; the exposed inputs are gypsum, fuel, clinker, and supplementary materials. Localisation protects the margin when the local input meets the specification, and destroys it when it does not. These cement manufacturing investment strategies in Africa start with the inputs that a plant still imports. Localisation is among the strategies driving growth in Africa’s cement manufacturing, reducing currency exposure.
Limestone and Gypsum: Nigeria’s Import-Substitution Record
Nigeria moved from full import dependence in 2000 to 95% local sourcing of limestone and gypsum by 2018, according to Nigeria’s Raw Materials Research and Development Council (RMRDC). Industry figures conflict, though: a decade ago, the Nigerian Society of Engineers reported that 75% of cement gypsum was still imported. Gypsum deposits occur in thin veins, which makes a consistent supply the real constraint. Cement manufacturing investment strategies in Africa should test the local supply claim before committing.
Currency risk magnifies the gap. When the local currency falls, imported gypsum, coal and clinker cost more in the same week, while a locally mined input does not. Ghana’s clinker import bill of close to USD 500 million a year shows how large that exposure can grow, and it explains why the Tema calciner pays back through avoided imports as much as through carbon savings. Local sourcing is among the cement production strategies in Africa that directly hedge currency risk.
Clay, Pozzolana and Biomass: Inputs That Replace Imports
Each local substitute in cement manufacturing in Africa attacks a specific import line. Calcined clay replaces imported clinker in Ghana, husks and shells replace imported coal in Kenya and Cameroon, and pozzolana replaces part of the clinker in blended grades. The table maps each exposed input to its lever. Alternative fuels in African cement manufacturing appear here as local biomass.
Raw Material Exposure and Localisation Levers
| Input | Exposure | Localisation lever | African example |
| Clinker | Foreign exchange and freight | Local kilns or clinker substitution | Kenya’s levy; CBI Ghana |
| Gypsum | Thin-vein deposits; import reliance | Support for local mining | Nigeria’s raw materials programme |
| Fuel | Imported coal and petcoke prices | Gas, local coal, biomass | BUA’s Kogi LNG; Matuga husks |
| Calcined clay and pozzolana | Thin ash and slag supply | Develop clay and volcanic ash deposits | Tema and Kribi calciners |
Grinding stations and SCM plants offer the cheapest entry to this strategy, which is why investment opportunities in cement manufacturing increasingly feature them alongside greenfield kilns. Investors should test clay and ash quality before committing, because a poor deposit costs more than the imports it replaces. Local clay supply anchors sustainable cement manufacturing in Africa at low capex.
Digitalisation and Process Automation
In cement manufacturing in Africa, a rotary kiln responds slowly to changes in fuel and feed, so small errors compound over hours. Automation matters most where fuel is variable and power is unreliable, which describes much of Africa. This section covers kiln control and the data gaps that limit it. Automation lifts output from existing lines, a cheap form of cement capacity expansion in Africa.
Advanced Process Control on Kilns and Mills
Model predictive control stabilises the burn before pushing variables towards their limits. Vendor-reported results for one leading platform include 1-3% higher product recovery, up to 30% lower quality variation, and up to 8% higher throughput, with payback within 12 months in many cases. Treat those figures as vendor claims, not audited outcomes.
Research supports the mechanism. A machine-learning model predicted kiln feed rate from 91 process inputs, which lets operators adjust before the kiln drifts. This control layer is what makes high alternative-fuel rates safe, because variable fuel disturbs the flame. Alternative fuels in African cement manufacturing depend on the control layer.
Digital Levers and Reported Effects
| Lever | Process target | Reported effect |
| Model predictive kiln control | Burning-zone temperature, fuel mix | Up to 8% more throughput (vendor claim) |
| Alternative fuel management | Feed rate, flame stability | Higher fuel substitution (vendor claim) |
| Mill and blend optimisation | Fineness, product recovery | 1 to 3% recovery; up to 30% less variation (vendor claim) |
| Machine-learning forecasting | Kiln feed rate | Prediction from 91 inputs (research) |
Predictive maintenance follows the same logic. Vibration and temperature sensors on kiln fans, mill drives, and conveyors flag failures days in advance, and a planned stop costs far less than a kiln trip. Cement production strategies in Africa that ignore maintenance data leave the plant exposed to unplanned downtime, wasting the capacity producers spent billions to build. A digital African cement manufacturer’s strategy pays back through uptime first.
Data Gaps Limit the Payoff
Few cement manufacturers in Africa publish digital results, so the evidence is thin. Optimisation also needs complete data, and plants often lack the as-fired fuel sampling that machine-learning optimisation requires. Producers should fix instrumentation first, because the best model fails on missing inputs. Until they do, the strategies driving growth in cement manufacturing in Africa rest on vendor claims.
Regional Distribution and Logistics Optimisation
Cement is heavy and cheap, so the delivered price in cement manufacturing in Africa depends on the route. Producers that shorten or cheapen that route win share without cutting the ex-works price. The sections below cover fleet economics, port capacity and border friction, which together show how cement manufacturers are expanding in Africa beyond their home markets. Logistics is one of the strategies driving growth in cement manufacturing in Africa, rivalling the copycat last.
Fleet Economics: CNG, Electric and Customer-Owned Trucks
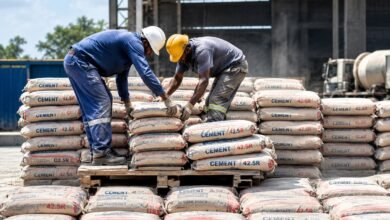
Dangote’s chairman reported that fuel costs are more than 60% lower for compressed natural gas trucks than for diesel, and the group plans to convert its Nigerian fleet by 2027. The Customer Truck Empowerment Scheme lets buyers finance trucks and repay them by hauling cement, building distribution capacity without tying up the producer’s balance sheet. Plants also choose between bulk versus bagged cement delivery by customer type, and each needs a different silo and loading capacity. Distribution capacity limits cement manufacturing capacity expansion in Africa as firmly as kiln capacity does.
Dangote Cement Logistics Programme
| Lever | Scale | Purpose |
| CNG trucks | Approximately 3,400 deployed in 2025; around 3,000 planned for Nigeria in 2026 | Lower fuel cost per kilometre |
| Electric trucks | Approximately 155 across pan-African operations in 2026 | Markets lacking gas infrastructure |
| Customer Truck Empowerment Scheme | Over 4,000 trucks provided | Distribution capacity and loyalty |
| Nigerian export terminals | Apapa and Onne, 2 Mtpa dispatch each | Clinker and cement exports |
| Overseas terminals | Ghana and Sierra Leone at 40,000 t; Senegal under construction | Bulk receipt for grinding plants |
Distance sets the competitive radius. A plant far from the coast serves inland buyers cheaply, while a coastal plant serves overseas buyers cheaply, and neither can win the other’s market on freight. Producers therefore pair inland kilns with depots and coastal kilns with terminals, which is how cement manufacturing capacity expansion in Africa translates into regional share.
Ports, Clinker Shipping and Export Corridors
Sea freight beats road for regional supply. Nigerian cement and clinker exports rose 18.6% to 1.4 million tonnes in 2025, and the group targets 10 million tonnes of exports by 2030. Terminal capacity at Apapa and Onne, plus a planned deepwater port in Ogun State, supports that target. Freight costs set the pace of growth in cement manufacturing across Africa.
Border Friction: VAT and Shipping Gaps
Road exports incur a tax penalty that hits cement manufacturers across Africa. Dangote’s export head said the group pays 18% VAT in Benin, Togo and Côte d’Ivoire on road shipments and that no ship was available to carry even 1,000 tonnes to Ghana, so the group plans to buy vessels. Trade integration under the continental free trade agreement will matter less than these two fixes. Cement manufacturing investment strategies in Africa should price these frictions into export plans.
Technical Block: Clinker, Heat and Utilisation Mechanics Behind the Eight Strategies
The cement production strategies in Africa rest on three pieces of engineering arithmetic. This block examines clinker factor, thermal substitution, and utilisation, the metrics that determine whether strategies driving cement manufacturing growth in Africa pay off. It also examines why consolidation in Africa’s cement industry leaves utilisation unchanged.
1. Clinker Factor Arithmetic: Why Blending Rivals New Kilns
The global average clinker-to-cement ratio stood at 0.71 in 2022, and the net-zero pathway needs 0.65 by 2030. The table shows what that shift means for a 3-million-tonne cement plant.
Illustrative Clinker Demand for a 3 Million Tonne Cement Plant
| Clinker-to-cement ratio | Clinker needed (Mt) | Saving versus 0.80 (Mt) |
| 0.80 | 2.40 | 0.00 |
| 0.71 | 2.13 | 0.27 |
| 0.65 | 1.95 | 0.45 |
| 0.55 | 1.65 | 0.75 |
Moving from 0.80 to 0.65 saves 0.45 million tonnes of clinker, approximately 28% of the 1.6 million tonnes on the Matuga line. Capex does not scale linearly, yet the comparison shows why blending competes with new kilns for capital. Investors comparing cement manufacturing investment strategies in Africa should run that comparison first.
2. Thermal Substitution Mechanics: What 25% Means in the Kiln
Kiln heat demand averaged 3.6 GJ per tonne of clinker in 2022, with a target of 3.4 GJ per tonne of clinker for 2030. At 3.6 GJ, a million tonnes of clinker needs 3.6 PJ, so each percentage point of substitution displaces 36 TJ. Dangote’s move from 9% to 25% therefore displaces 576 TJ per million tonnes of clinker, approximately 23,000 tonnes of coal at an assumed 25 GJ per tonne.
Higher rates raise control demands. Waste fuels bring moisture, chlorine and variable calorific value, so the kiln needs the tight control described under digitalisation before substitution climbs further. Alternative fuels in African cement manufacturing, therefore, need control upgrades as well as supply contracts.
3. Utilisation Mathematics: The Constraint Behind Every Plan
Fixed cost per tonne rises as utilisation falls, hurting cement manufacturing in Africa, especially where plants are idle. The index below sets full utilisation at 100.
Fixed Cost per Tonne by Utilisation Level (Index, 100% Utilisation = 100)
| Utilisation | Fixed cost index |
| 100% | 100 |
| 80% | 125 |
| 67% | 149 |
| 50% | 200 |
| 40% | 250 |
Ethiopia’s Lemi plant at 67% carries approximately 49% more fixed cost per tonne than at full load. Nigeria’s gap between 60 to 65 million tonnes of capacity and 25 to 30 million tonnes of consumption implies national utilisation of 38 to 50% before exports, which is 2.0 to 2.6 times the full-load fixed cost. Cement capacity expansion in Africa only pays when utilisation holds above break-even.
Conclusion: Cement Manufacturing in Africa Rewards Cost Position Over Capacity
The eight strategies for cement manufacturing in Africa do not carry equal weight. Clinker self-sufficiency and clinker substitution deliver the fastest margin because they cut the most expensive and carbon-intensive input. Logistics and captive energy come next, since they lower delivered cost in markets where grids and roads fail. Cement industry consolidation in Africa reshuffles owners but creates no new tonnes, and new plant construction without an export outlet, captive clinker, or an unserved corridor is the weakest bet on the list. The African cement manufacturers’ winning strategy combines a strong cost position with a clear route to market. Alternative fuels in African cement manufacturing sit in that second group.
The evidence points one way for cement manufacturing in Africa. Dangote’s integrated model, Bamburi’s clinker line, and CBI Ghana’s calciner each reduce a specific cost line, while idle capacity in Nigeria, Ethiopia, and Kenya punishes producers who built volume alone. For cement manufacturing in Africa, engineers should specify low clinker factors and variable-fuel capability at the design stage; investors should price utilisation before capacity; policymakers should pair clinker levies with standards for blended cements so that local supply and low-carbon products grow together.
Cement plant expansion in Africa should be driven by utilisation data, not announcements. Sustainable cement manufacturing in Africa depends on that pairing. The strategies driving growth in cement manufacturing in Africa share one trait: they reduce a specific cost line.
Follow Africa’s Cement Manufacturing Strategies
Construction Frontier: Cement & Concrete coverage tracks new kiln lines, clinker policy, alternative fuel programmes, low-carbon cement and plant logistics across African markets. Follow the section for engineering-grade analysis that helps engineers, investors, and policymakers judge which producers are building a real cost advantage and which are only adding tonnes.