

Kenya Cement Market: Strong Growth Outlook 2026–2030
The Kenya cement market passed a symbolic milestone in July 2026, when monthly production and consumption both exceeded one million tonnes for the first time on record, confirming a sharp recovery from the 2024 downturn. Full-year 2025 output reached 10.44 million tonnes and consumption 10.28 million tonnes, each up close to 20 per cent on the prior year, while a domestic clinker investment drive worth approximately KSh 133 billion and a reversed government tax decision are now redrawing the supply side ahead of 2030. Producers, contractors, and investors now operate in a market shaped less by installed capacity than by clinker self-sufficiency and a newly consolidated ownership structure.
Technical Snapshot: Kenya Cement Market Key Metrics (2026–2030)
| Category | Data |
| Installed Cement Capacity | 13–14 million tonnes annually |
| 2025 Full-Year Production | 10.44 million tonnes, up approximately 18% year-on-year |
| 2025 Full-Year Consumption | 10.28 million tonnes, up approximately 20% year-on-year |
| H1 2026 Production | 5.54 million tonnes, against 4.86 million tonnes in H1 2025 |
| July 2026 Production | 1.029 million tonnes, a record month |
| July 2026 Consumption | 1.008 million tonnes, up 13.5% year-on-year |
| Average Retail Price (Nairobi) | KES 730–855 per 50 kg bag |
| Clinker Import Levy | 17.5%, retained through 2026 |
| Domestic Clinker Investment Pipeline | Approximately KSh 133 billion (close to USD 1 billion) |
| Medium-Term Demand Growth Forecast | 7%–8% annually |
| 2026 Base Case Price Outlook | Stable, with 3%–5% annual increases |
These figures place the Kenya cement market firmly past its 2024 downturn and into a structurally different phase, one where clinker security and ownership consolidation, not headline capacity, will decide who profits from the country’s construction pipeline through 2030.
Introduction: Kenya’s Cement Market in 2026
The Kenya cement market has moved decisively out of its 2024 slump into a phase defined by record monthly output, an unresolved tax dispute over clinker imports, and a sweeping change of ownership among the country’s largest producers. Cement remains the input that sets the pace for the wider construction economy, so its performance offers one of the clearest signals of how Kenya’s building sector is truly performing, distinct from the broader trends across Africa’s cement markets and manufacturing base. This update revisits pricing, supply, and demand data through the third quarter of 2026, incorporating the shifts that have unfolded since early 2025.
Kenya’s cement producers no longer compete on installed capacity alone. Since late 2025, control of the industry has consolidated around a handful of investment groups racing to lock down clinker, the raw material that now decides margin and supply reliability more than any other single input. This analysis works through the current price structure, the policy fight over clinker imports, the ownership realignment reshaping Bamburi, Savannah, and East African Portland Cement, the industry’s early move toward low-carbon production, and a scenario-based outlook for supply, demand, and pricing through 2030.
Kenya Cement Market Structure and Dynamics
Understanding today’s Kenya cement market starts with capacity, participants, and the output data that separates paper capacity from what actually reaches building sites. Installed capacity has grown steadily even as utilisation continues to lag behind nameplate figures, a gap that recent clinker investment is only now beginning to close. This section sets out who produces the country’s cement and how production and consumption have moved since the 2024 contraction, before later sections turn to pricing and the structural forces reshaping the industry.
Installed Capacity and Leading Producers
Kenya’s cement industry comprises five major producers plus several smaller grinding operations, with installed capacity now estimated at 13 to 14 million tonnes a year as new clinker lines come online. Bamburi Cement, Devki Group’s National Cement, Mombasa Cement, Savannah Cement, and East African Portland Cement Company (EAPCC) account for the bulk of national output, a structure that mirrors the producer strategies examined across manufacturing strategies driving cement growth in Africa. Effective utilisation still runs between 55 and 75 per cent, constrained less by demand than by clinker access, energy costs, and, for two of the five majors, the aftermath of ownership disputes settled only in the past year.
Kenya’s Leading Cement Producers: Ownership and Status in 2026
| Producer | Current Position |
| Bamburi Cement | 96.54% owned by Tanzania’s Amsons Group since December 2024; building the KSh 32 billion Matuga clinker plant |
| National Cement (Devki Group) | Fully integrated; operates the West Pokot Cemtech plant and a second Cemtech plant in Kitui commissioned in early 2026 |
| Mombasa Cement | Independently owned; benefits from coastal, port-linked clinker logistics |
| Savannah Cement | Rescued from receivership in August 2025; now owned by Savannah Cement 2025 Limited, a consortium of flour-milling investors |
| East African Portland Cement (EAPCC) | Amsons-linked Kalahari Cement holds a 29.2% stake acquired in August 2025; it raised Blue Triangle prices in March 2026 |
Production and Consumption Through 2026
Data from the Kenya National Bureau of Statistics confirm the scale of the rebound. Full-year 2025 production reached 10.44 million tonnes, up approximately 18 per cent on the 8.85 million tonnes produced in 2024, while consumption rose to 10.28 million tonnes from 8.54 million tonnes, a recovery tracked in detail in the government’s most recent 2026 economic survey.
The rebound continued into 2026: production for the first half of the year reached 5.54 million tonnes against 4.86 million tonnes in H1 2025, and July 2026 became the first month in which both production and consumption crossed one million tonnes, closing at 1.029 million and 1.008 million tonnes, respectively, as cement use topped one million tonnes for the first time on a monthly record.
This pattern confirms a structural insight for the Kenya cement market: cement demand responds quickly once capital deployment aligns with project readiness, even after a sharp slowdown. Monthly output has now exceeded 900,000 tonnes consistently since the second quarter of 2026, a level not sustained since before the 2024 contraction, and the industry is on track to close 2026 with full-year production above 12 million tonnes if the current trajectory holds.
Cement Prices in Kenya: Current Levels and What Is Driving Them
Cement prices in Kenya reflect the same structural cost base as in prior years – energy, logistics, and foreign exchange exposure – but 2026 has brought a fresh round of manufacturer-specific price adjustments layered on top of that base. This section sets out current retail benchmarks before examining why prices remain sticky even as supply recovers.
Retail Price Benchmarks, January to September 2026
A 50 kg bag of cement in Nairobi has traded in a narrow band through 2026, with brand and grade positioning explaining most of the spread.
Cement Retail Price Benchmarks (2026, KES per 50 kg bag)
| Brand and Grade | Typical Retail Price |
| Simba 32.5R | 735 |
| Rhino 42.5N | 750 |
| Bamburi Fundi | 780 |
| Bamburi Tembo | 800 |
| Bamburi Nguvu | 855 |
| Bamburi Powermax | 1,350 |
| EAPCC Blue Triangle (CEM IV 32.5) | 765, following a March 2026 increase |
EAPCC raised the price of its Blue Triangle cement by KES 10 per bag with effect from 31 March 2026, an increase management attributed directly to sustained pressure from rising raw material costs, including clinker, energy, and transport. The adjustment, though modest at roughly 1.4 per cent, signals that producers are still defending margins even as consumption climbs, a pattern consistent with cost-led rather than demand-led pricing across the Kenya cement market.
Why Cement Prices in Kenya Remain Structurally Firm
Three cost components continue to anchor cement prices in Kenya above pre-2022 levels regardless of demand conditions. Energy accounts for 30 to 40 per cent of production cost, and grid instability continues to push manufacturers toward diesel back-up and, increasingly, solar and captive power. Logistics contributes a further 15 to 25 per cent of retail price, with regional counties paying a 5 to 15 per cent premium over Nairobi because of longer hauls on a low value-to-weight product. Currency exposure compounds both, since clinker, spare parts, and kiln equipment are priced in foreign currency, so any shilling depreciation raises production costs even when local demand is soft.
Kenya’s Clinker Self-Sufficiency Race
No development has reshaped the Kenyan cement market more in the past year than the scramble among Kenya’s three dominant industrialists to control domestic clinker supply. This section explains the plants under construction, the money behind them, and the tax policy reversal that now protects their investment case.
Three Plants, One Race
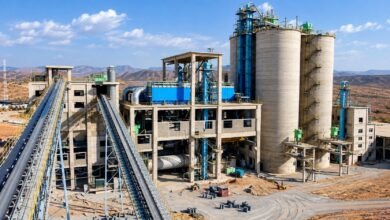
Narendra Raval’s Devki Group, Edha Nahdi’s Amsons Group, and newcomer Sarbjit Singh Rai are together committing close to KSh 133 billion to clinker production across East Africa, a capacity race that is remaking the region’s building-materials market after two decades of multinational control. Devki’s Cemtech subsidiary already operates a KSh 45 billion plant in West Pokot and commissioned a second, KSh 40 billion facility in Kitui in early 2026. Amsons’ Bamburi Cement has signed a KSh 32 billion EPC contract with China’s Sinoma CBMI for a 1.6 million tonne-a-year clinkerisation plant in Matuga, Kwale County, construction of which began in the first quarter of 2026 with clinker output targeted for 2028.
Kenya’s New Clinker Capacity Under Construction (2026)
| Plant | Sponsor | Capacity |
| West Pokot Cemtech | Devki Group | Operational since 2023 |
| Kitui Cemtech | Devki Group | Commissioned early 2026 |
| Matuga, Kwale | Bamburi Cement / Amsons Group | 1.6 million tonnes a year, clinker from 2028 |
| Nyeri (proposed) | Sarbjit Singh Rai | Filed for approval, capacity not yet confirmed |
Once operational, the Matuga plant will lift Bamburi’s clinker output from 1 million to 2.6 million tonnes annually and double the company’s cement production from 1.8 million to 4 million tonnes, positioning it as the largest single producer in the country and reinforcing the wider investment opportunities driving Africa’s cement expansion.
Further Reading: Cement Manufacturing Investment in Africa: 8 Promising Opportunities
The Tax Reversal That Reshaped the Debate
The clinker capacity race unfolded against a genuine policy reversal. The 17.5 per cent export and investment promotion levy on imported clinker, introduced in July 2023, cut clinker imports from 148,000 tonnes in 2023 to just 10,300 tonnes in 2024. In October 2025, Trade Cabinet Secretary Lee Kinyanjui petitioned Parliament to repeal the levy, arguing it left factories operating sub-optimally because domestic clinker holders sometimes refused to sell to competitors.
President William Ruto publicly rejected that position two months later at the Matuga signing ceremony, arguing that Kenya has sufficient limestone to produce its own clinker. By September 2026, the Trade Ministry had formally abandoned its repeal push, citing improved local clinker production, effectively locking in the levy and validating the KSh 133 billion domestic investment case behind it.
Ownership Consolidation Reshaping the Industry
Beyond new plants, the Kenya cement market has undergone the most significant ownership realignment in its history over the past eighteen months. Understanding who controls each producer now matters as much as understanding capacity, since ownership determines investment appetite, pricing discipline, and clinker access.
Switzerland’s Holcim exited Kenya in late 2024, selling its 58.6 per cent stake in Bamburi Cement to Tanzania’s Amsons Group for KSh 23.6 billion, after a rival KSh 25.7 billion bid from Savannah Clinker collapsed when that firm’s chief executive was arrested over unrelated fraud allegations and later released. Amsons has since built its holding to 96.54 per cent through a minority squeeze-out and, through affiliate Kalahari Cement, acquired a 29.2 per cent stake in EAPCC in August 2025 without triggering a mandatory takeover offer.
Separately, Savannah Cement, which had operated under receivership since 2023 owing KCB Bank and Absa Bank a combined KSh 14.1 billion, was rescued when a consortium of Kenyan flour millers acquired the business for KSh 3.8 billion through a newly formed entity, Savannah Cement 2025 Limited, unconditionally cleared by the Competition Authority of Kenya.
The practical effect is that a market once split between a multinational, a family-owned conglomerate, and several independents now concentrates around two aggressive regional investment groups, Amsons and Devki, whose combined clinker ambitions will determine pricing power for the rest of the decade. Investors assessing exposure to the sector increasingly weigh ownership stability alongside the fundamentals covered in Construction Frontier’s review of Kenya’s most established cement companies.
Low-Carbon Cement and the Push Toward Decarbonisation
A parallel shift, less visible in headline production figures but increasingly relevant to investment decisions, is the Kenya cement market’s early move toward low-carbon production. This matters because clinker is both the most carbon-intensive and the most capital-intensive component of cement, so reducing clinker intensity addresses cost and emissions simultaneously.
The United Nations Industrial Development Organization’s (UNIDO) Net Zero Partnership for Industrial Decarbonisation has worked with Kenyan producers and the Kenya Association of Manufacturers (KAM) on Limestone Calcined Clay Cement, a blend that can replace up to 60 per cent of clinker content without compromising strength, cutting manufacturing emissions by as much as 40 per cent while using materials already available domestically. The partnership is preparing a call for expressions of interest aimed at helping three to four Kenyan producers develop bankable low-carbon proposals.
It is also supporting government work on a green public procurement framework that would direct the Affordable Housing Programme and other public projects toward lower-carbon materials. Demand for cement in Kenya is projected to grow 7 to 8 per cent annually as the economy expands, giving producers who adopt clinker-substitution technology now a durable cost advantage as volumes scale.
Demand Drivers: Affordable Housing and Infrastructure
Cement demand in Kenya continues to track capital deployment more closely than any underlying structural ceiling, and 2026 data reinforce that public and private construction activity, not manufacturing capacity, remains the binding constraint on the Kenya cement market. This mirrors the broader growth drivers powering Africa’s cement demand, with Kenya as one of the continent’s clearest examples.
Nairobi’s building approvals rose 29 per cent to KSh 101 billion between January and May 2026, from KSh 78.3 billion in the same period of 2025, with residential approvals up approximately 20 per cent to KSh 73.2 billion and non-residential approvals nearly 60 per cent higher at KSh 27.8 billion. The State’s Affordable Housing Programme, which targets one million new homes, remains the single largest structural demand anchor, supplemented by transport works such as the Rironi–Mau Summit Road and continued investment in logistics parks and industrial zones.
Private commercial and residential construction has added incremental volume as lending rates have eased and the shilling has stabilised relative to 2023 and 2024, giving contractors more confidence to resume stalled projects rather than defer them further.
Further Reading: Africa’s Cement Market: 7 Growth Drivers Powering Regional Demand
Kenya Cement Market vs Regional Peers
Placing the Kenya cement market alongside Tanzania and Ethiopia clarifies why Kenyan pricing and supply risk differ from neighbouring markets despite broadly similar demand fundamentals across East Africa. Clinker self-sufficiency, energy structure, and inland logistics explain most of the gap, set out below for Tanzania and then Ethiopia.
East African Cement Cost Structure: Kenya, Tanzania and Ethiopia
| Factor | Kenya | Tanzania | Ethiopia |
| Clinker self-sufficiency | Improving; import levy retained through 2026 | High; integrated plants near limestone deposits | High; abundant domestic limestone |
| Primary energy source | Grid electricity plus diesel backup | Grid electricity; lower FX exposure on inputs | Hydropower, comparatively cheap |
| Distribution network | Most efficient in the region | Moderate; inland demand growing | Constrained by inland transport bottlenecks |
| Main price risk | Foreign exchange exposure on residual clinker imports | Limited; shielded by integration | Export restrictions limiting price competitiveness abroad |
Kenya vs Tanzania
Tanzania’s cement producers operate largely integrated plants sited near limestone deposits, which keeps clinker production close to raw material sources and reduces exposure to the foreign exchange swings that still affect cement prices in Kenya whenever imports are required. This structural advantage has kept Tanzanian cement pricing comparatively stable even through periods of regional currency pressure.
Kenya’s central cement plants cluster near the coast and around the Athi River, while demand growth increasingly concentrates further inland, lengthening haul distances and widening regional price dispersion. Kenyan contractors often pay a higher delivered price than their Tanzanian counterparts for this reason, even when headline bag prices look similar, a gap the new Matuga and Kitui clinker plants are designed to close by cutting import dependence rather than transport distance.
Kenya vs Ethiopia
Ethiopia’s cement producers benefit from abundant limestone reserves and comparatively cheap hydropower-linked energy, giving them a structurally lower clinker production cost than their Kenyan counterparts and stronger price competitiveness at the factory gate. These input advantages, however, do not fully translate into regional market power.
Inland transport bottlenecks, limited road capacity, and export restrictions slow Ethiopian cement distribution and constrain cross-border sales, while Kenya’s distribution network operates with greater efficiency and broader market reach. Kenya’s overall cost base remains higher because of electricity tariffs, fuel costs, and residual clinker import exposure, so the country’s advantage lies in getting cement to site faster rather than producing it more cheaply.
Cement Price Forecast Kenya 2026–2030: Scenario Analysis
Forecasting the Kenya cement market beyond 2026 requires scenario analysis rather than a single projection, since clinker self-sufficiency, energy costs, and infrastructure funding execution can each move independently. The three scenarios below update the original 2026–2030 outlook using confirmed 2026 production and policy data.
Base Case: Gradual Price Discipline with Rising Local Supply
Assuming GDP growth of 5 to 6 per cent, stable real energy tariffs, and steady infrastructure disbursement, cement prices in Kenya rise 3 to 5 per cent annually while supply gradually improves as the Matuga and Kitui plants ramp toward full output. Occasional regional shortages persist, particularly outside the coastal and central corridors, but forward procurement absorbs most of the impact for contractors on fixed-price contracts.
Upside Scenario: Clinker Self-Sufficiency Accelerates
If the Matuga plant reaches commercial clinker output ahead of its 2028 target and lending rates continue easing, capacity utilisation across the five majors climbs toward 80 per cent, price volatility falls, and producer balance sheets strengthen enough to fund further capacity without triggering a price war. This scenario would validate the KSh 133 billion domestic clinker bet within the current decade rather than beyond it.
Downside Scenario: Renewed Cost Shock
A sharp shilling depreciation, an energy tariff increase, or a stall in infrastructure disbursement similar to 2024 would intensify cement shortages in Kenya and push prices above general inflation, regardless of how much new clinker capacity has come online, since ramp-up delays at greenfield plants are common in the cement industry. Project delays and cost overruns would again become widespread across the construction sector.
Conclusion: Where the Kenya Cement Market Stands Heading Into 2027
The Kenya cement market enters 2027 from a materially stronger structural position than the one that framed the original 2026–2030 outlook. Record monthly production, a confirmed clinker investment pipeline worth close to KSh 133 billion, and a government decision that has now settled the long-running dispute over import taxation together confirm a market consolidating around fewer, better-capitalised producers rather than fragmenting under cost pressure. Three groups, Amsons, Devki, and the newly formed Savannah Cement 2025 Limited, now control the bulk of installed capacity and the clinker pipeline that will define supply through 2028.
Pricing will remain firm rather than fall sharply as supply improves, because producers are financing multi-billion-shilling clinker plants that require sustained margins to service the debt raised against them. This price floor is no longer a symptom of a temporary shortfall; it is now underwritten by billions of shillings in committed capital, and it will persist until that capital is repaid. Contractors, developers, and financiers who treat 2026’s easing supply as a signal that prices will soften are pricing risk incorrectly.
For anyone budgeting or financing a project through 2030, the priority is procurement discipline rather than price forecasting. Forward contracts, supplier diversification across the newly consolidated ownership groups, and close monitoring of clinker plant commissioning timelines through 2028 will do more to protect margins than any attempt to time the market against headline capacity figures.
Track The Kenya Cement and Concrete Markets
Cement pricing, clinker policy, and producer ownership can shift within a single reporting quarter, as 2026 has repeatedly demonstrated, so treating this market as static is the fastest way to misprice a project. Construction Frontier’s Cement & Concrete coverage tracks production data, clinker investment, ownership changes, and pricing trends across Kenya and the wider continent, giving engineers, developers, and investors a current, data-grounded view rather than a snapshot that ages within months.

One Comment