Nairobi BRT Plan: 5 Proven Lessons from Colombia’s TransMilenio Model
The Nairobi BRT Colombia model draws on Bogotá’s TransMilenio system for its corridor design, fare structure, and operator contracts. TransMilenio moves roughly 2 million passengers a day across 114 kilometres of dedicated bus. At the same time, Nairobi’s five gazetted BRT lines aim to cut a congestion bill estimated at over KSh 100 billion a year. The gap between the two systems, in governance discipline more than concrete, is exactly where the lessons for Kenya sit.
Technical Snapshot: Nairobi BRT Plan Core Project Specifications
| Metric | Detail |
| Benchmark system | TransMilenio, Bogotá, Colombia (operational since 2000) |
| TransMilenio network length | 114.4 km across 12 trunk corridors |
| TransMilenio daily ridership | approximately 2.01 million weekday trips (2024) |
| Nairobi gazetted BRT lines | Five corridors: Ndovu, Simba, Chui, Kifaru, Nyati |
| Lead Nairobi corridor | Line 2 (Simba), Thika Superhighway, 28 km, 10 stations |
| Nairobi’s annual congestion cost | estimated at KSh 100 billion to KSh 163 billion |
| Lead implementing agencies | NaMATA, KeNHA, Nairobi County Government |
Getting the Nairobi BRT Colombia model right is less about copying Bogotá’s buses and more about copying its discipline: how it chose corridors, paid its operators, and stayed the course through four changes of mayor.
Introduction: Nairobi’s Bus Rapid Transit Plan
Nairobi has spent more than a decade circling one conclusion: road widening alone will not fix its traffic. The city has gazetted five BRT corridors, piloted electric buses on Thika Road, and signed financing deals with the Millennium Challenge Corporation and Korea Exim B. Yet, only fragments of the network are running. Kenyan engineers and NaMATA officials keep returning to one reference point for what the finished system should look like: Bogotá’s TransMilenio, still the most studied BRT network in the world, twenty-five years after it opened, and the clearest working example of a Nairobi BRT Colombia model in practice.
Much of Nairobi’s public transport reform agenda over the past five years can be traced back to that single reference case. This matters beyond Nairobi’s ring roads. As explored in our analysis of the cause of traffic failure in African cities, congestion in fast-growing capitals rarely stems from a single bottleneck; it arises from overlapping failures in road capacity, land use, and transportation infrastructure. Nairobi’s fix depends on how faithfully it applies the operating logic behind Colombia’s BRT lessons, not just the visible hardware.
Nairobi’s Traffic Congestion Problem
Before judging what Nairobi should borrow from Bogotá, it helps to size the problem it is trying to solve. The city’s road network was built for a fleet several times smaller than the one it now carries, and the resulting gridlock is one of the most cited drags on Kenya’s urban economy.
Current Congestion Metrics and Economic Cost
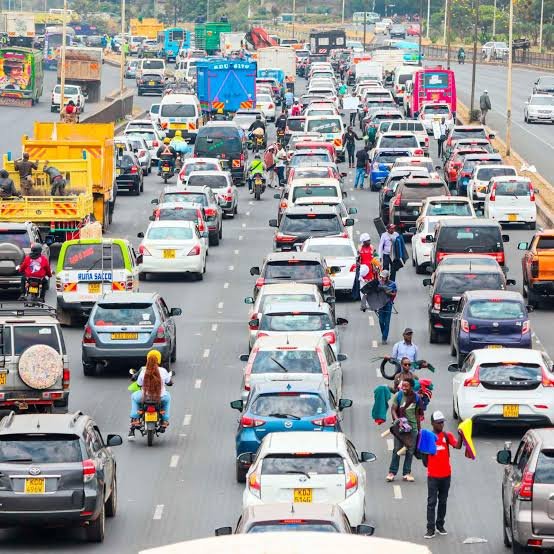
Kenyan transport data tells a consistent story across studies conducted a decade apart: congestion in Nairobi is worsening, not stabilising. NaMATA has previously put the productivity loss from vehicles stuck in traffic at close to USD 1 billion a year, a figure that ranked Nairobi among the world’s most congested cities in a widely cited government assessment. More recent modelling puts the combined cost of delay and wasted fuel at over KSh 160 billion a year, a figure that keeps climbing as Nairobi’s vehicle population outpaces its road capacity. The mechanics behind that figure, lost productivity, delayed freight, and higher logistics costs, are explored in our wider look at how urban gridlock hurts GDP across African cities.
| Congestion Indicator | Reported Figure |
| Average daily delay per commuter | approximately 62 minutes |
| Annual cost of delay (time lost) | approximately KSh 146.5 billion |
| Annual cost of wasted fuel | approximately KSh 16.7 billion |
| Share of trips by public transport | approximately 41% |
| Share of trips by private car | approximately 13% |
| Matatu’s share of commuter trips | over 70% |
Those figures explain why Nairobi settled on BRT rather than further road expansion: cars carry only 13% of trips yet consume most of the road space, while matatus and buses move the bulk of commuters on a fraction of the lane width. That imbalance sits at the heart of the wider shift away from private-vehicle dependency in African cities that are being forced to make, and it is the same argument that justified TransMilenio in Bogotá in the late 1990s and the starting point for any credible BRT case study Kenya can build on.
Further Reading: BRT Financing Models in Africa: 5 Effective Funding Strategies for Successful Bus Rapid Transit
Colombia’s TransMilenio Model
TransMilenio did not invent bus rapid transit (Curitiba, Brazil, built the first modern version in the 1970s), but it proved the concept could work at a metropolitan scale in a Latin American capital with chaotic pre-existing bus competition, not unlike Nairobi’s matatu sector today. How the TransMilenio Bogotá model was built, and how it is run, are the real values it offers as one of the clearest Bogotá BRT lessons for African cities weighing the same trade-offs.
System Design and Corridor Structure
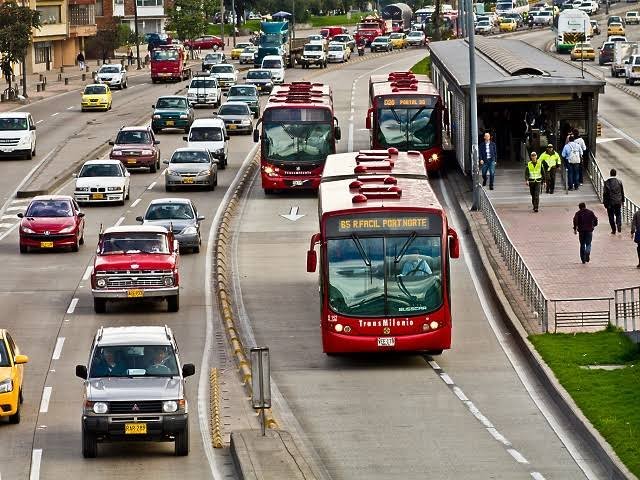
The TransMilenio Bogotá model opened its first 42 km phase in December 2000 and has since grown into a 114.4 km network across twelve trunk corridors with 143 stations, moving roughly 2.01 million weekday riders on articulated and bi-articulated buses. Stations sit in the road median, spaced roughly 500 metres apart, with level boarding from raised platforms that remove the loading delays typical of kerbside stops. Dedicated, physically segregated lanes keep buses out of mixed traffic, and peak headways on the busiest corridors have run as low as 13 seconds, giving the system a peak capacity of roughly 37,000 passengers per hour in each direction, throughput closer to a light rail line than a conventional bus service.
Governance and Operating Model
The design details are what everyone photographs, but governance is what keeps the system solvent. TransMilenio S.A. is a public entity that owns the infrastructure, plans routes, and regulates service quality, while private consortia operate and maintain the buses under performance-based concession contracts. Crucially, Bogotá restructured how operators are paid: instead of the old system, where informal bus owners earned more by racing rivals for passengers, TransMilenio pays concessionaires by kilometres operated, verified by GPS, with fare revenue pooled centrally and distributed under contract. That single mechanism removed the incentive for the reckless, competitive driving that plagued Bogotá’s pre-2000 bus sector, and it is the part of the Colombia BRT lessons that translates most directly to Nairobi.
Applying the TransMilenio Model to Nairobi
Nairobi, by the Nairobi Metropolitan Area Transport Authority (NaMATA), is not building on a blank slate. It is retrofitting BRT onto corridors that already carry some of the highest matatu and private-vehicle volumes in East Africa, and it eventually has to connect those corridors to the commuter rail network, the same challenge covered in our piece on linking BRT and rail in integrated urban transport planning. That layering limits how directly the TransMilenio model can be applied to Nairobi and is why this case sits at the centre of most African BRT adoption debates.
Corridor Selection Along Thika Road and Waiyaki Way
TransMilenio’s first corridor ran along Bogotá’s busiest existing bus route, not its most politically convenient one, and Nairobi’s own feasibility data points to the same logic. Surveys along the Line 1 (Ndovu) corridor recorded roughly 184,700 daily passengers on Waiyaki Way, with buses and matatus carrying over 80% of them on less than a third of the road space, a ratio almost equal to that that justified TransMilenio’s first Bogotá corridor.
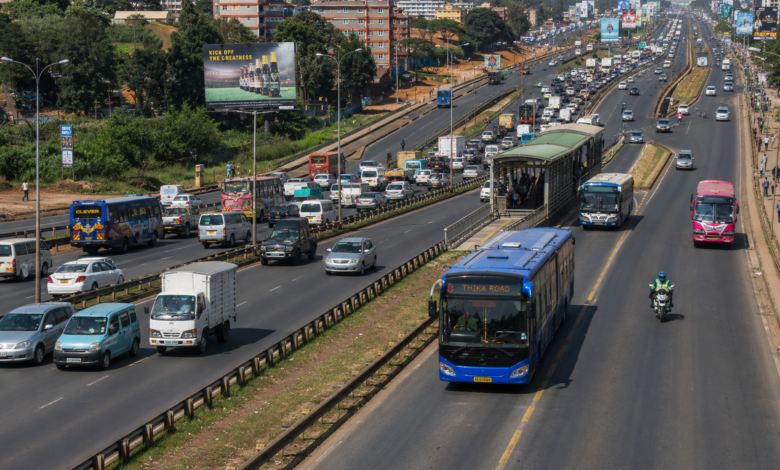
Lesson one: prioritise corridors by measured passenger volume, not political convenience. That is why Line 2 (Simba) along Thika Superhighway, one of Nairobi’s highest-volume commuter routes into the CBD, became the first corridor to reach active construction, with ten stations and a planned fleet of 100 buses designed for 90-second headways and up to 15,000 passengers per hour in each direction.
Adapting Fare Collection and Operator Contracts
Bogotá’s off-board, smart-card fare system is arguably harder to replicate than its concrete stations because it requires a single ticketing platform across all operators before the first bus runs.
Lesson two: centralise fare collection under one digital system from day one, rather than layering it onto routes after informal operators are entrenched, since retrofitting a shared platform onto competing SACCOs is far harder than launching with one. Kenya’s mobile money penetration gives Nairobi an advantage Bogotá never had in 2000, and NaMATA’s plans for the Line 2 corridor already assume mobile-linked digital payment from the outset.
Lesson three: The most often cited Kenyan official practice is paying operators by kilometres run under audited contracts rather than by passengers collected, the mechanism that ended Bogotá’s fare wars and is now the model NaMATA is negotiating as matatu SACCOs convert into formal concessionaires.
Lessons and Adaptation Challenges
Applying a Bogotá blueprint to Nairobi is not a straight substitution exercise. Urban form and the informal transport sector decide how much of it transfers directly.
Differences in Urban Density and Land Use
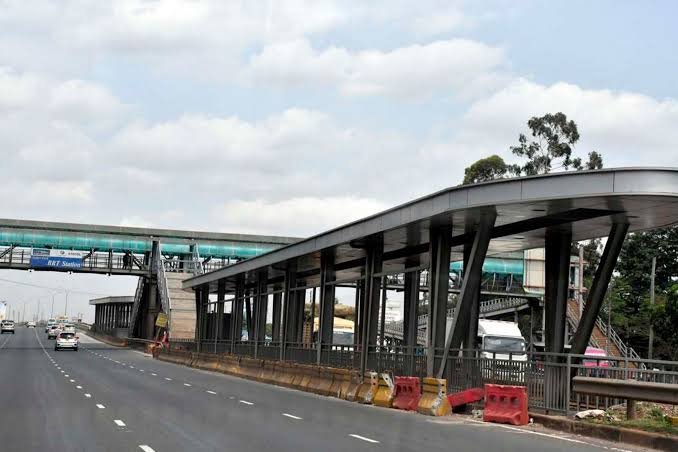
Bogotá built TransMilenio along wide, rectilinear avenues cut through a relatively planned grid, giving engineers room to fit four to six lanes plus median stations without extensive demolition. Nairobi’s key BRT corridors, aside from Thika Road, are narrower and hemmed in by decades of unplanned roadside development, which is why Line 4’s Jogoo Road alignment and Line 3’s Ngo’ng Road route have both required more complex land acquisition than Bogotá’s original corridors ever did. This is also why NaMATA is pursuing a closed, feeder-fed system on Line 4 rather than a fully open trunk network, phasing construction into a 13 km first stage instead of attempting the full corridor at once.
Matatu Sector Integration
Nairobi’s matatu sector carries a demand share that TransMilenio never had to negotiate with a competing informal fleet of similar scale. Bogotá’s answer, in essence, was to convert existing bus owners into shareholders of the new operating companies rather than shutting them out, softening the resistance that has derailed BRT rollouts elsewhere.
Lesson four: fold informal operators into feeder concessions and shareholding structures instead of trying to eliminate them outright. Nairobi has already tested a lighter version of this at Green Park, where matatu SACCOs were relocated into a regulated terminus with badge-based staff accountability and enforced dwell times, a useful marker of what Nairobi BRT design case study evidence should look like as the network matures.
Nairobi BRT Project Specifications
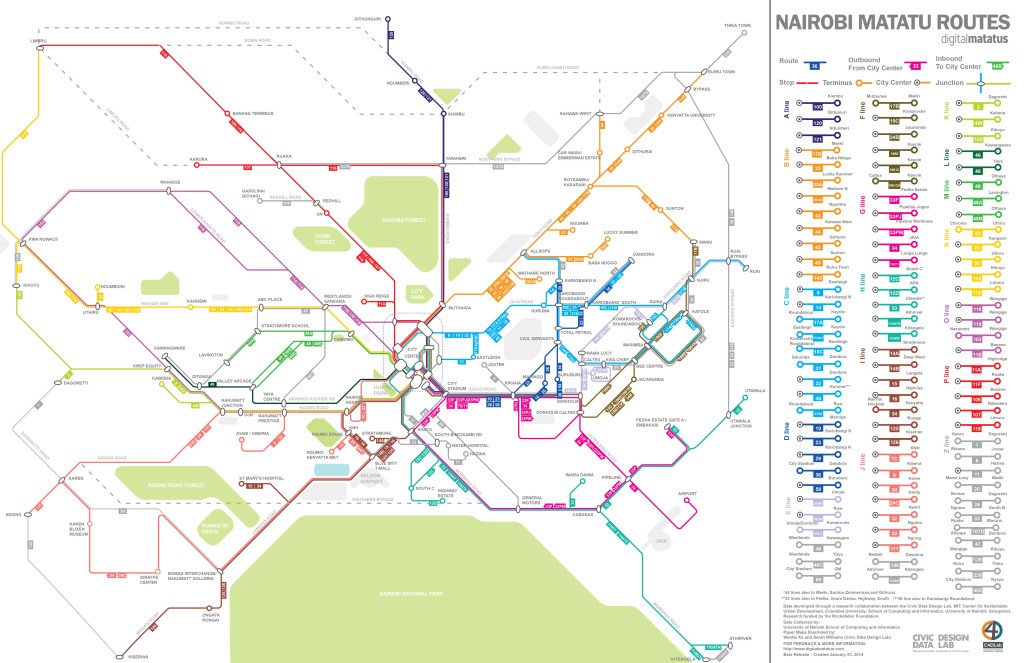
The gap between the plan and the pavement is still wide. Each of Nairobi’s five gazetted corridors sits at a distinct stage of design, funding, or construction, and the numbers below show how far this African BRT adoption effort still has to run.
Planned Corridor Lengths and Stations
| BRT Line | Route | Length / Stage |
| Line 1 (Ndovu) | Limuru–Kangemi–CBD–Athi River–Kitengela | Feasibility under review |
| Line 2 (Simba) | Rongai–CBD–Ruiru–Thika–Kenol | 28 km, 10 stations, under construction |
| Line 3 (Chui) | Tala–Njiru–CBD–Ngong | Detailed design submitted |
| Line 4 (Kifaru) | Dandora–CBD–Ngong Road–Karen–Kikuyu | Phase I: 13 km, 14 stations |
| Line 5 (Nyati) | Kiambu Road–Outering Road–Imara Daima | 30 buses, funding secured |
Timeline and Funding Sources
No single financier carries Nairobi’s BRT programme, a departure from Bogotá’s more centralised funding stack. Line 2’s electric bus fleet is backed by a KSh 8.7 billion agreement with the US Millennium Challenge Corporation. Line 5’s Outering Road works were financed through Korea Exim Bank, and the wider transit programme has drawn a KSh 43.4 billion allocation with European Union backing alongside a separate KSh 219 billion national commitment for its first phase.
That patchwork of loans, grants, and bilateral deals is typical of the continent, and it is unpacked in more detail in our review of funding models used across Africa’s BRT projects. Progress has been uneven: Line 2 construction has stalled more than once due to funding shortages, unlike the Trailenio Bogotá model, which kept building despite repeated changes in city leadership.
Lesson five: This, arguably, is the hardest to legislate: insulating the implementing authority from shifting political administrations and budget cycles, the continuity that allowed TransMilenio S.A. to keep building through four mayors between 2001 and 2016. Nairobi’s overlapping NaMATA-KeNHA mandate for the Thika corridor is one sign that coordination is still unsettled, and it fits a wider pattern of political barriers that have stalled BRT projects elsewhere in Africa, a reminder that Colombia’s BRT system, as a blueprint for Africa, depends on institutional discipline more than funding or technology alone.
Further Reading: BRT Governance in Africa: 5 Political Barriers to Project Success
Conclusion: What Nairobi Can Realistically Adopt
Nairobi does not need Bogotá’s exact station architecture or bus livery to benefit from the Nairobi BRT Colombia model. What transfers is the operating discipline underneath the concrete: corridor selection driven by measured demand, fare revenue pooled and distributed by contract rather than collected vehicle by vehicle, and informal operators absorbed as shareholders rather than displaced.
Line 2’s construction on Thika Road already reflects several of these principles, even where funding delays have slowed physical progress, and that alone answers much of what Nairobi’s BRT plan can learn from Colombia at this stage. It is also the clearest evidence yet of what a serious BRT case study Kenya can point to when arguing for the model elsewhere on the continent.
The honest constraint is pace, not ambition. TransMilenio took three years from political commitment to opening day because Bogotá centralised authority, financing, and construction sequencing under a single body. Nairobi’s programme is split across NaMATA, KeNHA, the county government, and multiple bilateral financiers, which is exactly why the governance lessons behind the Nairobi BRT Colombia model matter more than the engineering ones. Get the contracts, the fare pooling, and the institutional continuity right, and the stations will follow. Get them wrong, and Nairobi risks building TransMilenio’s hardware without its operating logic.
Transform Urban Mobility With Smarter Transit Planning
Explore more technical transport infrastructure analyses, urban mobility reviews, and public transit engineering deep dives on Construction Frontier: Urban Infrastructure & Transportation Systems, where BRT systems, sustainable transport, traffic management, and proven infrastructure solutions are examined through practical civil engineering insight.