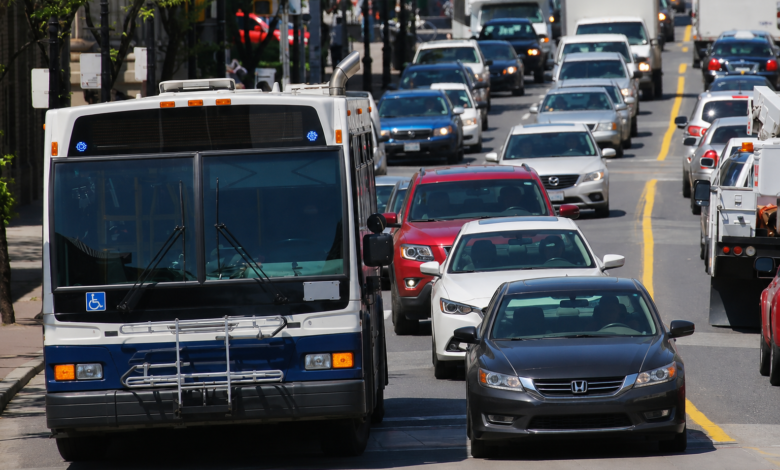
Public Transport vs Private Vehicles: 4 Overlooked Barriers to Shifting Mobility
Most residents of African cities already move by public transport or on foot, yet transport budgets, road design, and parking policy still favour the private car. In Nairobi, matatus and walking account for roughly 89% of adult commuters, while private cars account for under 10%, according to a 15-city household survey. Four structural barriers, unreliable service, weak safety guarantees, underused pricing tools, and status-driven demand, keep that mismatch in place across the continent. Closing the gap in public transport vs private vehicles dependency means building policy around how people already travel, not around how planners assume they should.
Technical Snapshot: Public Transport vs Private Vehicle Dependency
| Metric | Value |
| Nairobi commuters using matatus or walking | 89% of adult commuters (15-city Kenya survey) |
| Nairobi commuters using private cars | 9.7% of city residents |
| Africa’s current motorisation rate | 73 vehicles per 1,000 people, versus a global average of 300 |
| Projected African motorisation rate by 2050 | 150 vehicles per 1,000 people |
| Kenyans who see car ownership as personally important | 59% (Statista consumer survey, 2022) |
| Stockholm traffic reduction after congestion pricing | 20% drop in vehicles entering the toll zone |
| Rea Vaya BRT’s estimated daily car-trip reduction, Johannesburg | 21,300 fewer car trips per day |
A continent adding roughly one urban resident every second cannot resolve its traffic with road-building alone; the arithmetic of public transport vs private-vehicle dependency has to shift, or congestion will keep outpacing every new lane and flyover.
Introduction: Public Transport vs Private Vehicle Dependency
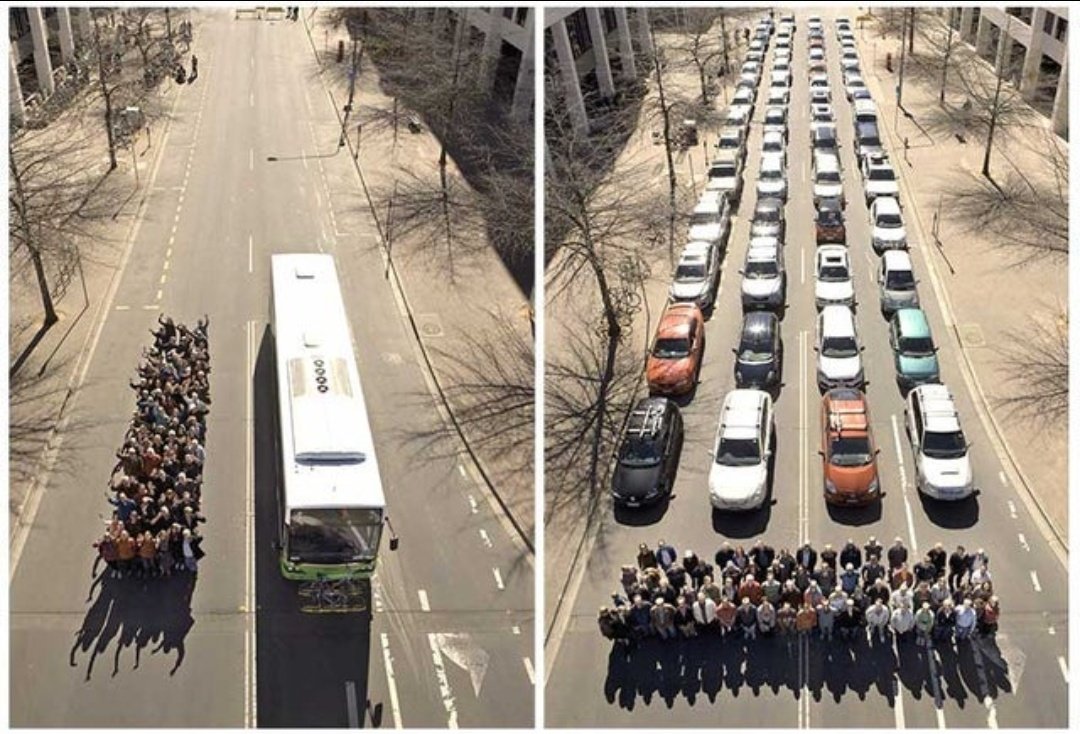
Ask a planning official in Nairobi, Lagos or Accra what causes gridlock, and the answer usually lands on the private car. That framing is only half right. As explored in our analysis of urban congestion in African cities, private vehicles occupy a disproportionate share of road space relative to the trips they carry, and public transport vs. private-vehicle dependency lies at the root of that imbalance.
The paradox is that most African commuters already choose collective transport by necessity, not by rejecting the car outright. They walk, they ride minibuses, they queue for shared taxis. A household survey spanning fifteen Kenyan cities and towns found that walking and matatus together account for the vast majority of adult commuting, with the private car remaining a minority mode almost everywhere on the continent, yet it dictates how streets, subsidies and enforcement priorities get allocated. The sharper question is not why African cities lack transit riders, most residents already are transit riders, but why people prefer private cars over public transport once income allows the choice.
Drivers of Private Vehicle Preference
Car ownership in African cities rarely reflects need alone. It reflects judgements about time, comfort and status that transit systems have yet to match.
Reliability and Comfort Perceptions
Private vehicle owners buy predictability. A car leaves when its owner is ready, follows a route the owner controls and avoids the informal negotiations that come with shared paratransit. Comparative research on car ownership in Lagos and Johannesburg found a strong statistical link between rising household income and rising car ownership, with each unit of income growth translating into a measurable increase in the number of vehicles purchased in both cities. That relationship is not really about the car itself; it is about what a car buys back: control over departure time and freedom from route changes imposed by operators chasing fares.
Public transport in most African cities cannot yet match that predictability. Paratransit, the minibuses, shared taxis and motorcycle taxis carrying the bulk of urban trips, holds the largest share of the market precisely because it fills gaps left by formal bus and rail networks, but its scheduling remains informal and its comfort variable. Until frequency and journey-time reliability close that gap, private vehicle use will continue to grow faster than transit ridership.
Status and Cultural Associations
Reliability explains part of the preference; status explains the rest. A 2022 consumer survey on mobility attitudes in Kenya found that 59% of respondents agreed that owning a car mattered personally to them, a figure well above what pure utility would predict. That number matters because it signals demand that price alone will not suppress. Car ownership operates as a visible marker of arrival into the middle class in many African cities, a signal that a household has moved beyond dependence on shared transport.
This cultural weight complicates behaviour change in ways that infrastructure investment alone cannot fix. A commuter who can afford a car but still uses transit may face social assumptions about their status, an unspoken cost that transit-oriented policy rarely accounts for. Reducing car dependency in urban Africa and reducing private vehicle use among households that can already afford a car needs to pair service improvements with a genuine shift in how transit is perceived, not just how it performs.
Barriers to Public Transport Adoption
If private vehicle preference explains the pull toward cars, the push away from public transport comes from the system itself. Two barriers dominate the rider experience: coverage gaps and safety concerns that disproportionately affect women.
Service Reliability and Coverage Gaps
Formal public transport in most African cities remains thin. Sub-Saharan Africa’s public transport is predominantly paratransit, and even where formal bus or rail services exist, they rarely cover the full metropolitan footprint. A study of bus demand patterns in Maputo and Nairobi found that the likelihood of choosing a public bus falls as vehicle ownership and employment status rise, evidence that formal buses lose riders precisely to the households transit planners most want to attract. Financing shortfalls compound the problem; as this publication’s review of BRT financing models in Africa sets out, capital-intensive corridors frequently stall for lack of sustainable funding.
Integration gaps worsen the coverage problem. A commuter who needs three separate fare payments and two unconnected transfers to cross a city will often choose a car or motorcycle instead, regardless of cost. Our examination of how cities link BRT and rail networks shows that fragmented systems, rather than the absence of transit altogether, often drive the switch to private vehicles, and it is exactly this kind of gap that keeps barriers to public transport adoption high even where formal networks technically exist.
Further Reading: Integrated Urban Transport Planning: 4 Ways Cities Link BRT and Rail
Safety and Security Concerns
Safety operates as a harder barrier than reliability because it affects who can use the system at all. A Women’s Empowerment Link survey of matatu passengers in Nairobi found that most of the 381 women interviewed had experienced gender-based violence while using public transport, a pattern a UN-Habitat toolkit on gender-sensitive minibus services traces to the same travel-pattern gap between men and women across the continent. A 2022 study of women and girls in Hawassa, Ethiopia, found that just over half of those surveyed had experienced more than one form of violence while using public transport.
These findings explain why public transport adoption barriers cut differently by gender. Households that can afford it often shift women commuters into cars to avoid harassment risk, converting a safety failure into private vehicle demand. Addressing this requires operator accountability, better lighting and monitoring at terminals, and enforcement against harassment, not just new buses on new routes.
Policy Levers for Behavioural Shift
Urban mobility behaviour change rarely follows from persuasion; it follows from changing the relative cost and convenience of each option. Two interventions have shown consistent results elsewhere: pricing tools that reflect the true cost of driving, and service quality upgrades that make transit genuinely competitive.
Congestion Pricing and Parking Policy
Congestion pricing remains rare in African cities but has a well-documented track record elsewhere. Stockholm’s congestion charge cut traffic across the toll cordon by approximately 20%, while the city’s population continued to grow over the following decade even as traffic fell. London’s congestion charge produced a comparable 20 to 30% reduction in traffic within the zone, alongside a 33% increase in bus travel. Across Stockholm, London and Singapore combined, roughly half of the trips discouraged from driving shifted to public transport or carpooling rather than disappearing entirely, evidence that pricing tools redistribute demand rather than simply suppressing mobility.
Congestion Pricing Outcomes: Comparative Results
| City | Traffic Reduction | Transit Impact |
| Stockholm | Approximately 20% within the toll cordon | Public transit usage increased following the implementation |
| London | 20-30% within the charging zone | Bus travel up 33%; 10% of trips shifted to walking, cycling or transit |
| Singapore, London, and Stockholm combined | 10-30% reduction in charging zones | Up to 50% of discouraged car trips are replaced by transit or carpooling |
No large African city currently runs a comparable scheme, but the underlying tools, parking levies, cordon charges and differentiated fuel taxation remain available. Even modest parking pricing in central business districts, paired with dedicated transit lanes, would begin to correct the subsidy that free or underpriced parking extends to car commuters.
Service Quality Improvements
Pricing tools only shift behaviour if the alternative is credible. Governance failures often undercut that credibility before service quality even becomes an issue; our review of political barriers to BRT project success traces how institutional friction between city authorities and informal operators has delayed corridor launches across the continent, regardless of funding levels.
Where service quality has improved through dedicated infrastructure, ridership has followed. Our case study on Nairobi’s BRT plan and Colombia’s TransMilenio model sets out how dedicated right-of-way, high-frequency service and integrated fare systems converted Bogotá’s paratransit-dominant market into one of Latin America’s highest-ridership bus systems, a template several African cities are now adapting.
Further Reading: Nairobi BRT Plan: 5 Proven Lessons from Colombia’s TransMilenio Model
Case Studies in Mobility Behaviour Change
Evidence for what actually shifts mobility behaviour, rather than merely reducing traffic on paper, comes from cities that combined pricing, service quality, and land-use policy, rather than relying on any single lever alone.
Cities That Reduced Car Dependency
Stockholm offers the clearest global example. When the $3 congestion charge trial began in 2006, two-thirds of residents opposed it; traffic still fell by 20% within months, and by the time of the permanent referendum in 2007, a majority voted to keep the charge. The city paired pricing with expanded transit capacity, ensuring that displaced car trips had a credible destination.
Within Africa, Johannesburg’s Rea Vaya offers a smaller but instructive case. Since launch, the corridor has been credited with removing an estimated 21,300 car trips per day and cutting the route’s carbon footprint by roughly half. Ridership has lagged initial projections, a shortfall linked to fare-recovery gaps and incomplete coverage rather than weak demand. Lagos’s earlier BRT-Lite corridor showed a similar pattern: ridership grew quickly, but the shift from private car users stayed modest, evidence that habitual car owners need security, speed and status, not just a bus, before switching.
Technical Block: Modal Share Data and Trends
Numbers make the case for reform more convincingly than anecdote. The following data situates public transport vs. car-use statistics in Africa within the current snapshot and the decade-long trajectory that policymakers are now trying to bend.
Modal Split Comparisons Across African Cities
Modal share varies sharply by city size, income distribution and the maturity of formal transit networks, but survey data from Lagos and Blantyre confirm that informal paratransit dominates almost everywhere private cars remain a minority mode, while Nairobi County’s own commuter figures put matatu and public service vehicle use even higher than the national household survey.
Modal Share by African Cities
| City | Walking | Paratransit / Minibus | Formal Bus / BRT | Private Car |
| Nairobi (15-city Kenya survey) | 42% | 48% (matatu) | n/a | 5% |
| Nairobi (KIPPRA county survey) | 17.1% | 58.7% (PSVs) | 3.7% | 9.7% |
| Blantyre, Malawi | 13% | 61% (minibus/sedan taxi) | n/a | n/a |
| Lagos, Nigeria (BRT-focused survey) | 2% | 17% (mixed modes) | 45% (formal bus/BRT) | n/a |
Trend Lines Over the Past Decade
Africa’s motorisation rate stood at approximately 73 vehicles per 1,000 people in recent estimates, compared with a global average of 300, but the continent’s vehicle fleet is projected to double by 2050, pushing the rate to roughly 150 per 1,000. Urban population growth drives most of that demand; Africa’s urban population is projected to grow by nearly 50% between 2020 and 2040, adding hundreds of millions of new residents who will make their first mode choice under current, largely car-favouring, policy conditions. Passenger cars already dominate new vehicle sales across Sub-Saharan Africa, and financing products cluster in cities with over one million residents, precisely the metros where transit investment should compete hardest for that demand.
Conclusion: Shifting the Default Choice
The evidence across Nairobi, Lagos, Johannesburg, Stockholm and London points to one conclusion: mobility behaviour shifts in Africa will not come from moral appeals to sustainability, or from road expansion that keeps subsidising the least space-efficient mode. It comes from making the default choice safer, faster and more predictable than driving. That requires simultaneous investment in service reliability, verifiable safety measures and pricing tools that make private vehicle use reflect its true cost.
African cities still hold an advantage that congested global capitals lost decades ago: most residents have not yet locked themselves into car dependency. Motorisation rates remain low, paratransit still carries the majority of trips, and the window to shape mobility behaviour before vehicle fleets double is still open. Cities that act now, pairing BRT and rail investment with governance reform and credible pricing, can avoid the decades of retrofitting that Lagos, Nairobi and Johannesburg are only now attempting.
Advance Sustainable Urban Mobility Solutions
Explore more technical transport infrastructure analyses, urban mobility reviews, and public transport deep dives on Construction Frontier: Urban Infrastructure & Transportation Systems, where sustainable transport, transit planning, traffic management, and proven engineering solutions for modern cities are examined through practical civil engineering insight.