BRT Systems in African Cities: 5 Design Principles Driving Mobility Reform
Bus Rapid Transit (BRT) systems in African cities combine dedicated busways, off-board fare collection, and platform-level boarding to move tens of thousands of commuters an hour at a fraction of rail costs. Lagos, Dar es Salaam, and Cape Town already carry a combined 500,000-plus daily passengers on corridors built in the last two decades. The five design principles behind these systems, corridor segregation, fare efficiency, station spacing, network integration, and phased delivery, determine whether a BRT corridor becomes a permanent mobility asset or a stalled construction site.
Technical Snapshot: Core BRT Systems in Africa Specifications
| Specification | Detail |
| Minimum corridor length to qualify as BRT | 3 kilometres, per the ITDP BRT Standard |
| Recommended right-of-way width | At least 14 metres for running lanes, plus 3 metres for station platforms |
| Optimal station spacing (urban) | 450 to 600 metres between stops |
| Boarding time with off-board fare collection | As low as 0.3 seconds per passenger on Gold Standard corridors |
| Largest operating African corridor by ridership | Dar es Salaam DART, carrying up to 400,000 passengers a day across 21 kilometres |
| Longest-running African BRT | Lagos BRT-Lite, in continuous operation since March 2008 |
Get the design principles wrong and a BRT corridor becomes an expensive bus lane that nobody trusts. Get them right, and BRT systems in African cities become the backbone of their transport networks for the next 30 years.
Introduction: Bus Rapid Transit Systems in African Cities
Bus Rapid Transit is fast becoming Africa’s preferred route out of the congestion crisis, city after city. Where metro rail can cost ten times more per kilometre and take a decade to build, a well-designed bus corridor can be operational within two to three years and still carry rail-like passenger volumes. That urgency is not abstract. It follows directly from the six critical causes of traffic failure gripping African cities today, from unmanaged vehicle growth to fragmented paratransit networks that leave planners with few fast, affordable options. Public transport reform Africa-wide increasingly starts with this single corridor-level decision. That urgency underpins nearly every BRT design principle for developing cities in Africa set out in this guide.
BRT systems in African cities are not simply painted bus lanes. A corridor only qualifies as true BRT when it meets a defined set of engineering and operational standards, dedicated right-of-way, off-board fare collection, platform-level boarding, and intersection priority, that together let buses move at metro-like speeds and capacities. Cities that skip these fundamentals end up with what planners call BRT creep, a branded service that looks rapid on a map but performs like an ordinary bus route in practice. Understanding the challenges of implementing BRT in Africa starts with recognising the gap between branding and engineering.
This guide sets out the five core design principles behind functioning BRT systems in African cities, the route planning logic that connects them into usable networks, and a practical implementation roadmap from feasibility study to opening day. It draws on operating data from Lagos, Dar es Salaam, and Cape Town, three of the continent’s most established corridors, to show what separates a Gold Standard system from a stalled construction site. Each principle below is a working answer to the BRT implementation challenges that have shaped Bus Rapid Transit in Africa over the past two decades.
Core Design Principles of BRT Systems
Every high-performing corridor among BRT systems in African cities rests on the same physical and operational fundamentals, regardless of which city builds it. Three of these principles do the heaviest lifting: how the corridor claims road space, how it collects fares, and how far apart it places its stations. Get anyone wrong and the whole system’s speed advantage collapses, no matter how much is spent on buses or branding. These are the same African BRT design principles that separate a Gold Standard corridor from an ordinary bus lane with a new coat of paint.
Dedicated Right-of-Way Corridors
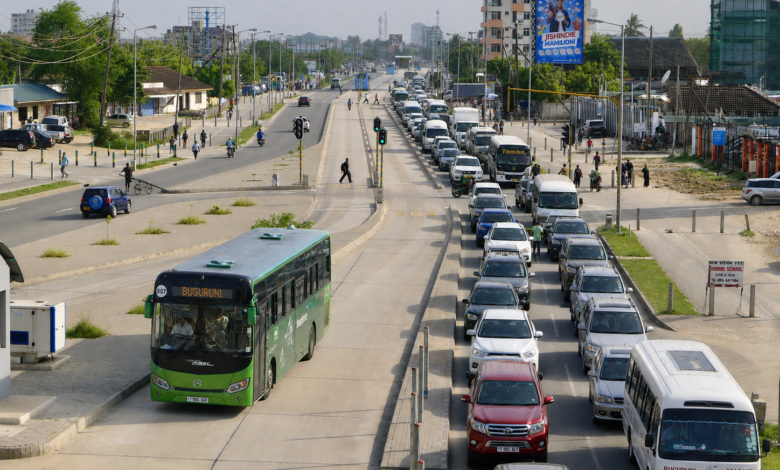
A dedicated right-of-way is the single feature that separates BRT from an ordinary bus service. It means the busway is physically segregated from general traffic, usually by a raised kerb, median barrier, or colour-differentiated pavement, so that private vehicles cannot encroach on bus lanes during peak congestion. Without this segregation, a BRT corridor loses its main advantage: predictable, congestion-immune journey times. It is the first and most consequential of the design principles behind BRT systems in African cities.
Median-aligned busways, running down the centre of the road rather than along the kerb, are now the preferred configuration across most African BRT design principles guidance, largely because they avoid conflicts with kerbside parking, informal trading, and minibus pick-ups that plague side-lane corridors. Engineering guidance from the global BRT design and scoring framework treats dedicated right-of-way as a non-negotiable “BRT basic”, alongside off-board fare collection and platform-level boarding. That distinction alone explains much of how BRT systems work in African cities compared with ordinary bus routes.
Right-of-way width is the first constraint in any conceptual design phase. Corridor designers typically need at least 14 metres for the running lanes themselves, plus an additional 3 metres wherever a station platform sits within the corridor, according to cross-section design guidance for BRT corridors. Where road reserves are narrower, as is common on retrofitted African arterials, planners must trade off passing lanes, cycling infrastructure, or sidewalk width rather than compromise the busway itself. This trade-off is at the heart of BRT design principles for developing cities working with constrained, already-built road networks.
Right-of-Way Configuration Comparison
| Configuration | Typical use case | Key trade-off |
| Median-aligned, two-way | High-demand corridors with wide medians | Requires pedestrian crossings at every station |
| Kerbside, contraflow | Constrained one-way streets | Higher conflict risk with turning traffic |
| Elevated or grade-separated | Extreme congestion points, river crossings | Highest capital cost per kilometre |
Whichever configuration a city chooses, it should match the traffic volumes and cross-section constraints unique to that corridor, since no single layout fits all BRT systems planned in African cities today.
Off-Board Fare Collection and Boarding Efficiency
Boarding speed decides how many passengers a BRT corridor can move per hour, and the fare collection method is the single biggest factor separating high-performing BRT systems in African cities from underperforming ones. On a conventional bus where a driver or conductor collects cash at the door, each passenger takes roughly two to four seconds to pay before finding a seat, a delay that compounds badly once passenger volumes climb during peak hours. Fare collection is where many early BRT systems in African cities lose the operational edge they gained from a dedicated corridor.
Off-board fare collection removes that bottleneck entirely. Passengers tap a smart card or scan a ticket at a station-side gate before the bus even arrives, so boarding happens through every door simultaneously rather than filing past a single farebox. The performance gap is stark: dwell time per passenger can fall from an average of five to six seconds on a conventional bus to as little as 0.3 seconds per customer on a Gold Standard corridor. That single change often enables a BRT corridor to reach its promised passenger capacity, and it is one of the clearest illustrations of BRT’s impact on urban mobility at the station level in Africa.
Lagos’s original BRT-Lite scheme illustrates both the promise and the limits of partial implementation. Because the pilot corridor retained onboard cash collection rather than full off-board fare gates, it never reached the highest BRT Standard tiers despite carrying 195,000 passengers on an average weekday within its first year of operation. The lesson for new African corridors is clear: fare infrastructure needs the same design priority as the busway itself, not a retrofit added once ridership arrives. It is one of the recurring challenges in implementing BRT in Africa that only emerges after a corridor opens.
Station Spacing and Passenger Flow
Station spacing is a balancing act between two competing demands: shorter walking distances for passengers and higher average bus speeds. Space stations are too close, and every stop adds dwell time that slows the whole corridor down; space them too far apart, and passengers abandon the system rather than walk the distance to reach them. Station spacing decisions are a core, often underestimated, part of how BRT systems work in African cities.
International planning guidance converges on a workable range. Urban BRT stations generally perform best spaced around 450 metres apart, extending to 600 to 700 metres for stations built with multiple sub-stops, and rarely exceeding 800 metres even outside dense built-up areas. This spacing minimises the total time a typical passenger spends between origin and destination, accounting for both the walk to the station and the in-vehicle journey. Bus Rapid Transit in Africa has generally converged on the same 450-600-metre range, regardless of city size.
Station width matters as much as spacing. A functioning BRT platform needs to be at least 3 metres wide to handle simultaneous boarding and alighting without crowding onto the running lanes, with wider stations required wherever passenger volumes justify multiple docking bays. Cities retrofitting BRT into narrow historic road reserves, a common constraint across older African city centres, often have to choose between shrinking pedestrian walkways or accepting narrower, lower-capacity stations. Neither compromise should come at the expense of the sidewalk, since pedestrian volumes around a new station only grow once the corridor opens. It is a reminder that the public transport reform Africa relies on has to serve pedestrians as much as it serves buses.
Route Planning and Network Integration
The design principles behind BRT systems in African cities only pay off once they are organised into a coherent network rather than a single isolated corridor. Route planning determines how passengers actually reach a BRT trunk line from their neighbourhoods, and how that trunk line connects onwards to rail, minibuses, and other formal transit once they arrive in the city centre. Two structural choices dominate this stage: whether to run trunk-and-feeder services or direct services, and how deliberately the system plans for interchange with other modes. Network planning is where urban mobility reform Africa-wide either compounds the value of a single corridor or leaves it isolated.
Trunk and Feeder Route Structures
The classic BRT network design pairs a high-capacity trunk corridor, running along the dedicated busway, with a web of feeder routes that collect passengers from surrounding neighbourhoods and bring them to trunk stations. This structure concentrates infrastructure investment on the single busiest corridor while extending the system’s practical reach across a much wider catchment area without needing dedicated lanes everywhere. This structure is now standard practice across most BRT systems in African cities that have moved past a single pilot corridor, a structural choice that shapes the wider urban mobility impact of BRT in Africa well beyond the trunk corridor itself.
An alternative, direct service, allows individual bus routes to operate partly on the trunk busway and partly in mixed traffic off-corridor, so passengers reach their destination without transferring at all. Guangzhou, Lanzhou, and a growing list of cities worldwide have adopted variations of this model specifically to reduce the friction of forced transfers, though it demands tighter coordination of scheduling and fleet allocation than a pure trunk-and-feeder system. Bus Rapid Transit in Africa is increasingly experimenting with both models within the same city.
Nairobi’s evolving BRT programme shows this planning logic in progress on the ground. The government has structured its network around distinct lines, each named after an animal, radiating from the central business district to outlying residential corridors, a deliberate echo of the trunk-and-feeder principle applied at the city scale and a practical demonstration of African BRT design principles at the network level. The city’s approach to sequencing corridors and adapting proven international models is examined in detail in Nairobi’s plan to apply lessons from Colombia’s TransMilenio to its own congestion crisis.
Further Reading: Nairobi BRT Plan: 5 Proven Lessons from Colombia’s TransMilenio Model
Interchange Design with Rail and Paratransit
A BRT corridor that dead-ends at a terminal without a clean connection to other transport modes forces passengers into exactly the kind of fragmented, multi-fare journey that BRT is meant to eliminate. Interchange stations, where BRT meets commuter rail, informal minibus ranks, or non-motorised transport, need dedicated design attention from the earliest planning stage rather than being treated as an afterthought once the busway itself is finished. Interchange quality is one of the clearest measures of how BRT systems in African cities actually perform end-to-end. Interchange planning is consistently ranked among the toughest challenges of implementing BRT in Africa, precisely because it depends on cooperation between agencies that rarely share a single budget.
Well-designed interchanges place BRT platforms, rail platforms, and feeder bus bays within a single, weather-protected walking distance, with a unified fare system, so passengers are not penalised for switching modes mid-journey. Where formal rail does not yet exist, as is the case across most of the continent, interchange design instead has to formalise transfers with the paratransit operators who currently dominate first- and last-mile trips, integrating rather than displacing them, another of the practical challenges of implementing BRT in Africa that rarely shows up in a corridor’s original business case.
The practical approaches cities are using to physically and operationally link BRT with rail networks are set out in strategies for connecting BRT corridors with urban rail lines in African cities.
Implementation Roadmap: From Planning to Operation
Even a well-designed corridor within BRT systems in African cities can stall for years if the implementation sequence is wrong. Delivery moves through three broad phases, each with its own risks: establishing the case for a specific corridor, building it while keeping the city moving, and lining up the operators and buses that will actually run the service once construction finishes. Each phase carries its own set of BRT implementation challenges specific to African procurement and construction markets.
Feasibility and Corridor Selection
Corridor selection starts with demand data, not political convenience. Planners model existing travel patterns along candidate roads to confirm passenger volumes will justify the investment, then stress-test the corridor against the minimum length threshold of 3 kilometres of dedicated lane that defines true BRT under international standards. Routes with the highest existing informal minibus traffic tend to make the strongest technical case, since that traffic proves latent demand for a fast, formal alternative. Corridor selection is the first of many decisions that shape how BRT systems in African cities ultimately perform, and it is where urban mobility reform Africa-wide either gains or loses momentum before construction even starts.
Feasibility studies also have to confront institutional and political risk head-on, not just engineering questions, since the biggest challenges of implementing BRT in Africa are rarely technical. Land acquisition disputes, resistance from existing minibus and informal operators facing displacement, and shifting political priorities across election cycles have delayed or derailed multiple African corridors long before construction crews ever arrive on site. These non-technical barriers are frequently the deciding factor in whether a technically sound corridor gets built on schedule, a dynamic explored in the political barriers that have stalled BRT projects across the continent. Public transport reform Africa needs cannot outrun the institutional groundwork a corridor requires before construction even begins.
Construction Phasing and Traffic Diversion
Building a dedicated busway down the middle of an already congested arterial road is, by definition, a disruptive undertaking. The best-managed African corridors phase construction in short segments, closing and rebuilding one section of road at a time rather than the full corridor length simultaneously, so that traffic can be diverted onto parallel routes without paralysing the wider city. Construction sequencing is one of the more underrated design principles behind BRT systems in African cities. Traffic diversion planning is one of the most disruptive challenges of implementing BRT in Africa’s densest city centres.
Dar es Salaam’s DART programme demonstrates the value of phasing at a network scale rather than just within a single corridor. The city sequenced its BRT rollout across six planned phases, covering 154.4 kilometres of trunk corridor in total, opening each phase to passenger service as soon as it was ready rather than waiting for the entire network to be completed. That approach allowed the first 20.9-kilometre phase to begin generating ridership and revenue years before the later phases were completed, softening the financial and political pressure of a single, all-at-once construction programme. It is a template that other cities pursuing Bus Rapid Transit in Africa have started to copy directly.
Operator Contracting and Fleet Procurement
The contracting model chosen for bus operations shapes service quality throughout the corridor’s life, often more than the infrastructure design itself. Most successful African BRT systems have moved away from a single monopoly operator toward competitively tendered contracts, frequently structured to formalise existing minibus associations into regulated bus companies rather than displacing them outright, a pattern increasingly common across BRT systems in African cities, a shift that has itself become one of the defining BRT implementation challenges of the last decade.
Fleet procurement decisions, vehicle size, door configuration, and fuel type need to be locked in well before opening day, since bus specifications determine station platform height, docking bay length, and depot design. Financing this fleet is typically the single largest capital outlay in the entire programme, and the range of models cities have used to fund it, from public-private partnerships to concessional development bank loans, is covered in the funding strategies underpinning successful BRT rollouts across Africa.
Getting this stage right is central to BRT design principles for developing cities with limited upfront public capital. Operator quality is itself part of the urban mobility impact of BRT in Africa, since service reliability depends as much on the operating company as on the infrastructure.
Further Reading: BRT Financing Models in Africa: 5 Effective Funding Strategies for Successful Bus Rapid Transit
Case Studies from African BRT Corridors
Three corridors illustrate the full range of outcomes BRT systems in African cities have produced so far, and together they form some of the best BRT systems in Africa case studies available to planners today: a pioneering but only partially compliant scheme, a rapidly scaling network built to a higher standard from the outset, and a system that has struggled to move beyond its pilot phase after fifteen years. Together, they show how BRT systems work in African cities under very different funding and governance conditions.
Lagos BRT (BRT-Lite Model)
Lagos opened Africa’s first BRT scheme along the Mile 12 to CMS corridor in March 2008, branding it BRT-Lite to reflect its status as a lower-cost pilot rather than a full Gold Standard system. The corridor stretched 22 kilometres across 28 stations, deployed through a public-private partnership in which the transport authority provided the busway infrastructure and terminals while a private operator supplied and ran the bus fleet, an early template for BRT systems in African cities that many later corridors would adapt, an early proof point that public transport reform Africa-wide could work at a megacity scale.
Ridership exceeded every early projection. The system carried more than 200,000 passengers daily, over 150 percent above the original forecast, prompting an extension from Mile 12 to Ikorodu in 2015 and a second corridor along Oshodi-Abule Egba in 2020. Over its operating life, the network has carried in excess of 400 million passengers, a scale that places it among the busiest bus corridors in the world by daily boardings, underlining the scale Bus Rapid Transit in Africa can reach even from a single pilot corridor.
BRT-Lite’s limitations stem directly from the design compromises made to keep costs down at launch, most notably onboard rather than off-board fare collection and only partial physical segregation of the busway. These gaps illustrate why African BRT design principles increasingly treat the full BRT Standard checklist as a target from day one, rather than a set of upgrades to retrofit once the corridor proves itself. Lagos remains a useful case study of BRT’s impact on urban mobility in Africa when a corridor is built to a partial standard. Its launch also set an early precedent for BRT design principles for developing cities working with legacy road networks rather than greenfield sites.
Dar es Salaam DART System
Tanzania’s capital opened the first phase of its Dar Rapid Transit system in May 2016, and it remains the highest-capacity BRT corridor in East, Southern, or Central Africa. The completed first phase runs 20.9 to 21.1 kilometres across 29 stations and five terminals, operated by UDA Rapid Transit under a fleet that has grown from an initial 140 buses to 210, making it one of the fastest-scaling BRT systems in African cities and a natural anchor point among the best BRT systems in Africa case studies for planners to study.
Daily ridership has climbed from roughly 180,000 passengers shortly after opening toward a stated capacity of 400,000, supported by dedicated median-running lanes and pre-board fare gates that align closely with the full BRT Standard rather than a scaled-back version. Annual boardings on the system rose from 3.8 million in 2016 to 5.7 million by 2022, tracking the gradual expansion of fleet size and service frequency across those years, evidence of steady public transport reform that Africa can point to when arguing for further BRT investment and illustrating how BRT systems work in African cities once fare collection and dedicated lanes are combined from day one.
DART’s long-term ambition extends well beyond its current single operating phase. The city has planned six total phases covering 154.4 kilometres of trunk corridor by 2030, with the second phase already more than two-thirds complete and the third under active construction, making DART the most extensive BRT expansion programme currently underway on the continent, and arguably the strongest of the best BRT systems in Africa case studies available today.
Cape Town MyCiTi
Cape Town’s MyCiTi system took a markedly different path to launch, opening its first pilot routes in 2010 specifically to serve the FIFA World Cup before expanding into a permanent network the following year. Rather than building on an existing pilot corridor, the city worked with international BRT advisors from the outset and used the project to formalise a significant share of its informal minibus taxi industry into regulated operating companies, an approach now referenced across other BRT systems in African cities, a story frequently cited among the best BRT systems in Africa case studies for balancing formalisation with network reach.
The network has since grown into one of the continent’s most extensive, spanning 39 routes across 42 stations and almost 1,000 stops, with a fleet that now includes electric buses alongside diesel vehicles. Annual ridership reached roughly 20 million trips in the most recent reporting year, translating to around 2.3 million passenger trips per month across the entire network rather than a single corridor, a scale few other Bus Rapid Transit systems in Africa have matched.
MyCiTi’s experience is a useful counterpoint to Lagos and Dar es Salaam because much of its network operates in mixed traffic rather than fully dedicated lanes, a pattern some analysts describe as BRT creep. The dedicated busway core, rated at bronze standard when it opened, remains the system’s performance backbone, while the wider mixed-traffic network extends geographic coverage at the cost of guaranteed journey times. It is a trade-off every African city weighing BRT implementation challenges eventually has to make: build a shorter corridor to the highest standard, or a longer network with variable performance. It is a trade-off central to how BRT systems operate in African cities facing real budget constraints.
Case Study Comparison: Three African BRT Systems
| System | Opened | Corridor length | Daily ridership | Fare collection |
| Lagos BRT-Lite | 2008 | 22 km | 200,000+ | Onboard (partially off-board planned) |
| Dar es Salaam DART | 2016 | 20.9 km (Phase 1) | Up to 400,000 | Off-board |
| Cape Town MyCiTi | 2010 | 20 km dedicated lanes | ~660,000/month equivalent | Off-board, tap card |
Lagos, Dar es Salaam, and Cape Town are not the only BRT systems in Africa worth studying, but together they capture the full spectrum of design maturity found across the continent today.
Measuring Mobility Impact
Understanding how BRT systems work in African cities in practice, rather than on paper, means looking past corridor design to the actual urban mobility impact of BRT in Africa once passengers start using it. Two metrics dominate how planners and investors judge whether a BRT system in African cities has delivered on its promise: how fast and reliably it moves the passengers already using it, and how successfully it pulls new passengers away from private vehicles and unregulated minibuses.
Ridership and Journey Time Metrics
Ridership growth is the most visible measure of BRT performance, but journey time reliability matters just as much to the daily commuters the system is built for. A corridor that carries impressive passenger volumes while still losing significant travel time to mixed-traffic sections or fare-collection bottlenecks has not solved the underlying congestion problem; it has only relocated it. The clearest evidence that a corridor is meeting design standards is a consistently high average operating speed across peak and off-peak hours, since speed variability is usually the first sign of encroachment or fare-collection delays. Tracking it consistently is essential to measuring the true performance of BRT systems in African cities.
The economic case for prioritising these metrics is substantial. Congestion imposes measurable productivity losses on African cities long before a BRT corridor is ever built, a cost quantified in detail in the GDP impact of unresolved urban gridlock. Every minute a BRT corridor saves a commuter over the alternative, whether private car or informal minibus, compounds into that broader productivity case for the investment, part of the wider urban mobility impact of BRT in Africa that extends well beyond the corridor itself.
Modal Shift from Private Vehicles
The deeper test of a BRT system’s success is whether it changes travel behaviour rather than simply absorbing passengers who were already using public transport. A genuine modal shift, with private car owners choosing to leave their vehicles at home in favour of the BRT corridor, is harder to achieve than ridership growth alone and depends heavily on journey time competitiveness, fare affordability, and perceived safety and comfort relative to driving. A modal shift is the truest test of whether urban mobility reform Africa-wide is actually changing behaviour rather than just adding capacity.
Cities that have achieved measurable shifts away from private vehicle dependency have typically paired BRT investment with complementary demand-management tools, such as congestion pricing, parking restrictions, or minibus route restructuring, rather than relying on the new corridor’s appeal alone. The specific barriers that keep African commuters wedded to cars and informal transport even after a BRT corridor opens nearby are examined, with a focus on public vs private vehicles, and aim to shift commuters away from private-vehicle dependency. Closing that gap is arguably the single hardest test facing urban mobility reform Africa-wide.
Further Reading: Public Transport vs Private Vehicles: 4 Barriers to Shifting Mobility
Technical Block: BRT Infrastructure Specifications
The technical specifications behind a BRT corridor determine its ceiling on passenger capacity and operating speed years before the first bus enters service, and they form the practical core of BRT design principles for developing cities more broadly. Two elements carry the most design weight: how the corridor’s physical footprint is engineered, and how the bus fleet itself is specified to match that footprint. Both sit at the technical centre of BRT systems in African cities, regardless of city size. Specification decisions made at this stage quietly determine many of the BRT implementation challenges corridors face later in operation.
Corridor Width and Station Design Standards
Design engineers begin every BRT cross-section with the available right-of-way, since that width dictates subsequent trade-offs among running lanes, station platforms, cycling infrastructure, and pedestrian space. A workable baseline allocates roughly 14 metres for the busway itself, an additional 3 metres wherever a station sits within the corridor, and a minimum unobstructed sidewalk width of 2 metres, rising to 2.5 or 3 metres in areas with heavier pedestrian flow. These allocations are standard across African BRT design principles guidance, not city-specific preferences.
Station platforms need to be at least 3 metres wide under international scoring standards, widening further wherever multiple docking bays are required to handle peak-hour bus frequencies. Where road reserves are constrained, as is typical when retrofitting BRT into established African arterials, designers should reduce mixed-traffic lane widths or remove on-street parking before ever narrowing the sidewalk, since pedestrian demand around a new station only increases once the corridor opens. Getting this balance right is one of the more overlooked BRT design principles for developing cities to prioritise.
BRT Station Design Parameters
| Parameter | Standard |
| Minimum station platform width | 3 metres |
| Preferred platform width (dual-side boarding) | 6 metres |
| Minimum unobstructed sidewalk width | 2 metres |
| Recommended station spacing, urban | 450–600 metres |
| Maximum recommended station spacing | 800 metres |
Fleet Specifications and Capacity Planning
Bus specification decisions cascade through nearly every other element of corridor design, from station platform height to docking bay length. Articulated buses of 18 metres carry substantially more passengers per vehicle than standard 12-metre buses, but they demand longer docking bays, wider turning radii at terminals, and platform-level boarding hardware engineered to match their specific floor height, a specification decision that shapes every one of the BRT systems in African cities examined in this guide, a detail often missing from otherwise thorough African BRT design principles documentation.
Door configuration is just as consequential for capacity as vehicle length. Multiple door channels dramatically compress boarding time per passenger; moving from a single door to four separate boarding channels can cut per-passenger boarding time under a fully prepaid fare system from roughly 2.5 seconds to under one second, according to transit capacity and quality of service research. That difference alone can determine whether a corridor meets its planned passenger-per-hour capacity or persistently falls short during peak periods. Door configuration is a small design choice with an outsized effect on Bus Rapid Transit’s overall passenger capacity in Africa.
Conclusion: Building BRT Systems That Last
The African cities that have built durable BRT systems, Dar es Salaam foremost among them, share a common thread: they treated the full BRT Standard as a baseline specification rather than an aspirational upgrade to add later. Dedicated right-of-way, off-board fare collection, and disciplined station spacing are not cosmetic features. They are the mechanical reasons a corridor can move 400,000 people a day instead of 40,000, and the reason a system survives a change in political administration instead of stalling half-built. Together, they form the technical backbone behind every one of the design principles driving BRT systems in African cities forward, a body of evidence increasingly cited as one of the best case studies for new corridors.
Cities weighing the challenges of BRT implementation today have far more evidence to draw on than Lagos did in 2008. The lesson from fifteen years of African operating experience is that corridors built to the full standard from day one outperform those retrofitted piecemeal, and that route planning, interchange design, and operator contracting deserve the same engineering rigour as the busway itself. Urban mobility reform Africa-wide and public transport reform Africa-wide will not come from any single flagship corridor, but from cities applying these design principles consistently, phase after phase, network after network.
Design Smarter BRT Systems for African Cities
Explore more technical transport infrastructure analyses, urban mobility reviews, and public transport engineering deep dives on Construction Frontier: Urban Infrastructure & Transportation Systems, where BRT systems, transit planning, sustainable mobility, and proven engineering solutions for African cities are examined through practical civil engineering insight.