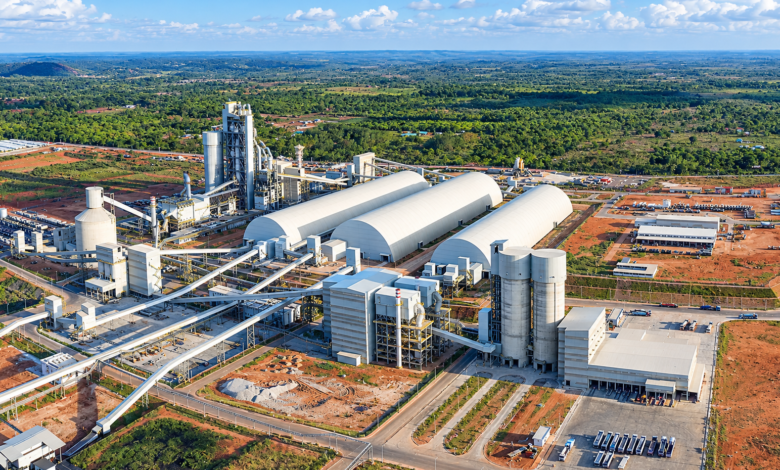
Cement Industry in Africa: Complete 441 Mt Guide to Markets, Manufacturing, and Growth
The cement industry in Africa operates approximately 441 million tonnes (Mt) of capacity per year, about 8% of the world’s total, yet holds 42% of all cement capacity currently under construction. Egypt, Nigeria, Algeria, and Morocco anchor Africa’s cement production, while Dangote Cement, Huaxin Cement, and Heidelberg Materials lead a market that Chinese and regional buyers are reshaping. Every road, home, and port starts with a tonne of clinker, and per capita use across the continent still sits far below the global average.
Technical Snapshot: Core Industry Specifications
| Parameter | Specification |
| Operating capacity | Approximately 441 Mt a year, about 8% of world capacity |
| Build pipeline | 43.3 Mt under construction and 23 Mt announced, lifting the total to approximately 507 Mt (+15%) |
| Market value | USD 25 to 35 billion in annual output value (published estimates vary widely) |
| Top producers | Egypt, Nigeria, Algeria, Morocco, and South Africa; Kenya and Ethiopia lead East Africa. |
| Growth rate | Published demand estimates range from 4.7% to 8% per year; Kenya’s consumption rose by 20.3% to 10.3 Mt in 2025. |
| Key drivers | Urbanisation, public infrastructure spending, and a housing deficit of approximately 53 million homes |
| Largest companies | Dangote Cement (55 Mt in Africa), Huaxin Cement, and Heidelberg Materials (27.8 Mt across nine African markets) |
| Binding constraint | Energy cost and reliability, plus foreign exchange for imported fuel and spares |
| Fastest levers | Alternative fuels, captive solar, clinker substitution, and export terminals |
| Benchmark metric | The European dry-process average is 3.73 GJ per tonne of clinker; long dry kilns burn 33% more, and old wet kilns up to 85% more. |
| Structure shift | Holcim has exited Nigeria, Kenya, Uganda, and Tanzania; Huaxin, Amsons, and West China Cement have entered. |
The cement sector in Africa is moving from import substitution to export competition, and producers who control energy costs will set the price of every building on the continent. This guide maps the markets, manufacturers, and numbers behind that shift.
Introduction: Cement Industry in Africa
The cement industry in Africa is building faster than any other region on earth. Kiln data on Africa’s cement boom shows 16 African countries adding new lines, with 43.3 Mt of annual capacity under construction. Nigeria accounts for 10 Mt of that total, the largest national pipeline after India, although the continent accounts for only 8% of the world’s cement capacity.
The driver is a consumption gap that has barely closed. In 2020, Africa’s cement industry trends showed per capita use of 435 kg in North Africa but only 113 kg in sub-Saharan Africa, while global cement consumption averages above 500 kg per capita. Closing that gap demands new plants, new logistics, and new energy supply. That makes cement a better gauge of African construction than any single project announcement.
This guide covers the full cement market in Africa: who produces, who buys, what it costs, and where the risks sit. Plant-level tactics, from clinker substitution to waste-heat recovery, sit in the manufacturing strategies powering regional growth. Here, the focus is on the market, the money, and the numbers.
The Scale and Structure of Africa’s Cement Industry
How big is the cement industry in Africa? Operating capacity stands at approximately 441 Mt a year, spread across three very different blocs: an export-oriented North, a capacity-heavy West, and a supply-short East and Centre. The sections below cover where production stands, how far imports still matter, and how the product is divided by grade and channel.
Regional Production Hubs
The top cement-producing countries in Africa start in the North. Egypt holds the continent’s largest installed base, and its producers have spent two years balancing the home market against an export habit. Algeria built capacity ahead of demand and now hunts for foreign buyers. Morocco serves a growing domestic market under regulatory pressure, since its Competition Council has proposed a structural overhaul of the sector.
Table: Leading African Cement Markets, 2025 and 2026 Indicators
| Market | Capacity or output indicator | Structural position |
| Egypt | Capacity of approximately 88 Mt; output of approximately 66 Mt | Exporter under a 30% export cap; seven to nine idle lines returning |
| Nigeria | Dangote alone at 35.25 Mt; 10 Mt under construction nationally | Three-producer market; retail price of NGN 12,000 to 15,000 per 50 kg bag |
| Algeria | Producer-reported output of approximately 40 Mt against demand of approximately 22 Mt | Surplus exported: GICA shipped 6 Mt of cement and clinker in 2023. |
| Morocco | Domestic sales of 13.71 Mt, January to November 2025 | The Competition Council proposes a sector overhaul. |
| South Africa | Capacity of approximately 20 Mt at 60% utilisation | Imports of 1.49 Mt (+25%), about 90% from Vietnam |
| Kenya | Consumption of 10.3 Mt in 2025 (+20.3%) | The retail price of KSh 850 per bag in December 2025 |
| Ethiopia | Dangote plans to double Mugher to 5 Mt (USD 400 million). | Expansion led by foreign capital |
West Africa runs on concentration. Three producers account for most of Nigeria’s installed capacity, and Dangote’s share of about 60% makes it the price setter, a position that Huaxin’s acquisition now challenges. Coastal neighbours such as Ghana depend on grinding plants fed with clinker, which turns part of the cement market into a clinker trade.
East Africa consumes little per capita, but volumes are climbing fast, and Ethiopia is chasing scale with foreign capital. Southern Africa has the opposite problem: South Africa holds spare capacity and still imports cement. A market short of cement beside a market short of buyers defines the cement market in Africa in 2026.
Demand Versus Import Dependency
Imports matter less as a share of volume than as a price signal. South Africa faces rising import pressure: imports reached 1.49 Mt in 2025, up 25%, with Vietnam supplying about 90% of the total, while domestic plants operated at approximately 60% utilisation. Local producers argue that imported cement avoids the carbon tax they pay, which tilts the field before freight is factored in.
Egypt shows the export side. Egypt’s cement industry in 2025 lifted finished-cement exports by 47.4% to 11.1 Mt, while clinker exports fell by 38%, a shift toward higher value per tonne. Egyptian ports still lack bulk terminals for 45,000-tonne vessels, and Titan Egypt’s chief executive put Vietnamese cement at USD 32 per tonne, compared with USD 50 for the Egyptian product.
Nigeria’s exports climbed 18.6% to 1.4 Mt in 2025, including 34 clinker shipments to Ghana and Cameroon, as Dangote’s capacity push targeted African demand. On this coast, clinker rather than cement dominates cross-border trade because the cost of building a grinding mill is far less than building a kiln line. Whoever owns the clinker owns the regional price.
Market Segmentation
Segments of the cement market in Africa differ by grade, channel, and buyer, and each runs on a different cycle. Bulk cement follows government spending. Bagged cement follows household income. Blended cements follow the carbon and cost pressures that push producers to replace clinker with supplementary cementitious materials (SCMs).
Table: Cement Market Segments by Grade, Channel, and Buyer
| Segment | Typical buyer | Market signal |
| Standard 32.5R, bagged | Self-builders and small contractors | Simba retail price of KSh 735 per bag, January 2026 |
| Premium 42.5N, bagged | Structural contractors | KSh 1,200 per bag, 63% above 32.5R |
| Bulk cement | Infrastructure and ready-mix | South African bulk sales fell by 30% due to weak civil activity. |
| Blended and SCM-based | Cost- and carbon-sensitive builders | SCMs could cut African concrete emissions by 26% to 29% by 2050 |
The 63% premium for 42.5N shows where margin sits in Kenya’s cement prices: in strength class, not volume. A producer tied to one channel carries the full swing of that channel’s cycle. Producers with bulk, bagged, and blended ranges tend to have steadier earnings.
Key Players Shaping the Market
The largest cement companies in Africa fall into three groups: pan-African majors with multi-country networks, national champions that dominate one home market, and new entrants buying assets sold by Western groups. Ownership is changing faster than capacity.
Pan-African Majors
Dangote Cement leads African cement manufacturers, and its nine-month earnings report lists 55 Mt of installed capacity, including 35.25 Mt in Nigeria, where the Obajana plant alone operates 16.25 Mt across five lines. The company targets 80 Mt by 2030 and signed a USD 1 billion agreement with Sinoma for 12 projects across seven countries. Its 6 Mt Itori plant in Ogun State is due for completion in November 2026.
Scale gives Dangote cost leadership at home, but rivals compete on region and brand as much as tonnage. Readers who want the full league table can compare the leading cement brands across Africa by footprint and product range.
Huaxin Cement redrew the second tier. It completed its purchase of Lafarge Africa, now renamed HBM Nigeria, in a deal reported at USD 1 billion. Huaxin Cement’s expansion plans reach beyond Nigeria. Before that deal, Huaxin already held 24.7 Mt of overseas grinding capacity across 12 countries, six of them in Africa.
Heidelberg Materials builds steady, mid-sized positions instead. Its sub-Saharan African operations total 27.8 Mt across nine African markets, led by Egypt at 9.0 Mt and Morocco at 6.7 Mt.
National Champions
National champions hold the home market and add capacity there. BUA Cement lifted revenue by 34.6% to NGN 1.18 trillion in 2025 and signed a CBMI to build a 3 Mt line in Sokoto. Algeria’s state group, GICA, produces approximately 19.5 Mt and targets 10 Mt in exports, while PPC defends South Africa against cheap imports.
Kenya shows how champions compete once ownership changes. Bamburi, the country’s largest producer, was acquired by Amsons from Holcim in December 2024, and forex losses at Bamburi of KSh 900 million highlight the currency risk the new owner inherits. Anyone comparing the strongest cement companies in Kenya should weigh grade range and distribution reach alongside plant size.
New Entrants and Ownership Shifts
Holcim has spent three years leaving African markets it considers fragmented. Chinese producers and African conglomerates have bought the assets.
Table: Major African Cement Ownership Changes, 2023 to 2026
| Asset | Seller | Buyer | Detail |
| Mbeya Cement (Tanzania) | Holcim (65%) | Amsons Group | The sale was agreed in November 2023 |
| Hima Cement (Uganda) | Bamburi (70%) and Cementia (30%) | Sarrai Group and Rwimi Holdings | USD 84 million for 70% and USD 36 million for 30%; completed March 2024 |
| Bamburi Cement (Kenya) | Holcim (58.6%) | Amsons Group | Amsons reached 96.54% in December 2024, with the offer of KSh 65 per share. |
| Lafarge Africa (Nigeria) | Holcim (83.81%) | Huaxin Cement | Reported at USD 1 billion; completed 2025 |
| AfriSam (South Africa) | Existing owners | West China Cement | Competition Commission approval in May 2026, with conditions |
The pattern matters more than any single deal. Chinese groups buy at scale and bring in contractors to build the next line, while regional groups such as Amsons buy for market access. In South Africa, PPC cites dumping risk in the AfriSam deal: AfriSam could become a distribution platform for cement made in Mozambique, so the regulator approved the purchase only with conditions on capital spending and local procurement.
Manufacturing and Production Technology
Technology determines costs across Africa’s cement sector, and costs decide who survives, with freight offering little protection. The three subsections below cover the kiln routes in use, the capacity and utilisation trend, and the fuel and power choices that now separate profitable plants from stranded ones.
Dry Versus Wet Process Overview
Every plant in the cement industry in Africa heats limestone and clay to approximately 1,450°C to form clinker, then grinds the clinker with gypsum and additives. The route to clinker matters most. The dry process with multistage preheating and precalcination is the global state of the art, and the thermal energy efficiency gap to older routes shows why. The step-by-step cement production sequence covers each stage from quarry to bag.
Table: Kiln Routes and Thermal Energy Demand
| Route | Fuel use against a preheater-precalciner kiln | Practical consequence |
| Dry, preheater and precalciner (PH-PC) | Baseline: European average of 3.73 GJ per tonne of clinker in 2010 | Specification for new lines worldwide |
| Long dry, no preheater | Approximately 33% higher | Larger coal or gas bill per tonne |
| Old wet process | Up to 85% higher | Uncompetitive without very cheap fuel |
Africa’s advantage is timing. A line commissioned in 2027 can specify the best available kiln, preheater, and cooler from day one, while older markets can only match that through retrofits.
Further Reading: Cement Manufacturing Process: 7 Proven Key Stages from Quarry to Bag
Capacity Trends
Cement industry trends in Africa 2026 point in one way: more capacity, faster. Operating capacity of approximately 441 Mt gains 43.3 Mt under construction and 23 Mt announced, lifting the total to approximately 507 Mt, a 15% rise. Nigeria accounts for 10 Mt in the construction pipeline, or 23% of the continental total, and cement industry growth in Africa now rests on those lines.
Utilisation tells the other half. Egypt’s cement market operated near 87% of capacity in 2025 and still has idle lines, with nine due back by the end of 2026, amid Egypt’s push to limit exports. South Africa sits near 60%. New capacity will find buyers in supply-short markets and will pressure prices where supply already exceeds demand.
Energy and Fuel Mix
Energy is the binding constraint. Fuel and power account for the largest share of cash costs in African cement production, and both carry currency risk when producers import coal, petroleum coke, or spares. Dangote reported a 59.2% EBITDA margin for its Nigerian business in the first nine months of 2025, attributing it to a more favourable energy mix, underscoring how fuel choice can drive profits.
Reliable power matters as much as cheap power. Kilns run continuously, and every trip costs refractory life and output. Engine suppliers make the case for cement industry energy security, reporting availability above 98% and load-following between 10% and 100% within minutes, which suits swinging grinding loads and gives solar a dependable partner.
Alternative fuels offer the fastest cost lever where supply exists. Titan Egypt currently achieves 40% thermal substitution, and Titan’s capacity investment targets 70% by 2030. Egyptian producers still face a bottleneck, since they cannot currently import alternative fuels, and local supply falls short.
Market Growth Drivers and Demand Trends
Cement demand in Africa varies widely by country. Still, three forces recur across the cement market: urbanisation, state infrastructure programmes, and a housing deficit that households fill one bag at a time. The forces behind regional cement demand feed each other. A growing city creates a housing shortfall, which in turn creates demand for infrastructure.
Urbanisation
Urban growth sets the baseline. The green cement opportunity in Africa rests on demand that could rise an estimated 230% by 2050, which equates to approximately 4.9% per year compounded over 25 years. Cities use cement for frames, roads, and drainage, whereas villages use earth and timber, so every point of urbanisation lifts consumption per head.
Infrastructure Spend
Public spending sets the cycle. Kenya’s consumption jumped 20.3% to 10.3 Mt in 2025 as softer construction inflation eased input costs to 0.5% and pipeline projects advanced. In Egypt, national projects account for 62% of consumption, a base that underpins Egypt’s international cement strategy. South Africa shows the downside: bulk cement sales fell 30% when civil works stalled.
Housing Deficit
The housing deficit turns demand into volume. Estimates put Africa’s housing shortage at 53 million homes, with projections of 130 million by 2030 if delivery does not accelerate. Incremental self-build converts that deficit into bagged retail demand, so retail pricing, covered below, becomes the number that matters.
Investment and Expansion Activity
Capital is flowing into the cement industry in Africa for three purposes: new integrated plants, grinding stations close to cities, and upgrades that cut fuel bills. The subsections below separate the build pipeline from the financing structures behind it.
New Plant Announcements
Announced projects span the continent. Dangote’s Itori line adds 6 Mt in Ogun State, and BUA has contracted a further 3 Mt at Sokoto. Among South-East Africa’s cement developments, Shuntai’s 2.2 Mt Chegutu plant in Zimbabwe will more than double the country’s integrated capacity to 3.9 Mt. Mozambique’s third plant, the 1.1 Mt Muxúnguè project, broke ground in August 2026.
Investors sizing up entry options, from greenfield plants to clinker grinding stations, will find that investment opportunities in African cement manufacturing differ sharply by entry mode and return horizon.
JV and Financing Trends
Contractors increasingly act as partners and financiers. Sinoma, CBMI, and AVIC build many of the new lines, and PPC is exploring a Colleen Bawn expansion with Sinoma in Zimbabwe. Local banks back ownership transfers too: KCB gave an irrevocable bank guarantee of KSh 23.6 billion for the Amsons bid in the Bamburi sale.
Currency risk shapes every structure. Producers import coal, spares, and grinding media in dollars but earn revenue in naira, shillings, or birr. Dangote’s USD 400 million Ethiopian plant expansion, doubling Mugher’s capacity to 5 Mt, shows a producer willing to bear that risk for market share.
Pricing and Regional Market Dynamics
Price is where the whole chain shows. Fuel, freight, and currency feed straight into the bag price, and market structure decides how much of any cost increase reaches the buyer. The subsections below break down the cost drivers and compare price levels by country.
Cost Drivers
Experts questioning the rise in cement prices in Nigeria offer a cost breakdown for a 50 kg bag, showing where the money goes. Pyroprocessing, the kiln stage, takes approximately 46% of the total, which is why fuel choice dominates margins.
Table: One Analyst’s Cost Stack for a 50 kg Bag of Cement in Nigeria
| Stage | NGN per bag | Share of total |
| Extraction and crushing | 500 | 6.5% |
| Proportioning, blending, and raw grinding | 950 | 12.4% |
| Pyroprocessing | 3,500 | 45.8% |
| Finish grinding | 1,200 | 15.7% |
| Packaging, storage, and logistics | 1,500 | 19.6% |
| Total | 7,650 | 100% |
That total sits well below the NGN 12,000-15,000 range that buyers paid in July 2026 amid the rise in Nigerian cement prices. Nigeria’s competition regulator has opened a probe into possible price manipulation in the cement market, noting installed capacity of 60 to 65 Mt against demand of 25 to 30 Mt. BUA attributes high prices to energy, transport, and currency costs. The stack is an unaudited estimate: use it to test producer claims, not to prove a margin.
Kenya shows the same pass-through. A 50 kg bag rose from KSh 650 in December 2022 to KSh 850 in December 2025, a 31% increase, amid skyrocketing cement prices that lifted construction costs.
Country-Level Variance
Price levels diverge sharply between markets, and the causes differ. Nigeria pairs a concentrated supply base with a weak naira. Kenya pairs a more competitive field with a shilling that has held steady. Egypt shows the policy route: prices peaked in 2025, and the government answered by capping exports at 30% of production.
Table: Retail Price per 50 kg Bag, Nigeria and Kenya
| Market | Price per bag | Approximate price per tonne | Period |
| Nigeria | NGN 12,000 to 15,000 (USD 7.80 to 9.75) | USD 156 to 195 | July 2026 |
| Kenya | KSh 850 (approximately USD 6.60 at KSh 129 per USD) | Approximately USD 132 | December 2025 |
At those rates, a Nigerian bag costs 18% to 48% more than a Kenyan one in dollar terms. Kenya’s cement growth outlook to 2030 sets the volume path, with prices trailing. Brand, grade, and region affect Kenyan bag prices as much as the national average does, so budget holders should consider these factors before setting a rate.
Further Reading: Kenya Cement Market: Strong Growth Outlook 2026–2030
Africa’s Cement Industry: Structural Outlook and Strategic Position
This block turns the market data into arithmetic. Five checks test the cement industry in Africa on capacity, the demand path, the heat bill, trade logic, and risk. Africa’s cement industry outlook 2030 depends less on announced tonnes than on whether these numbers hold.
1. Capacity, Output, and Utilisation Arithmetic
Announced capacity looks large until it meets output. The bridge below converts the pipeline into totals, and Egypt supplies a consistency test. Output of 66 Mt at 87% utilisation implies approximately 76 Mt of operating capacity. Adding the 12.6 Mt of idle lines returning brings the total to approximately 88 Mt, which matches the nameplate capacity.
Table: Capacity Bridge to Pipeline Completion
| Item | Mt per year | Note |
| Operating capacity | 441.0 | Starting point |
| Under construction | +43.3 | Nigeria holds 10 Mt, or 23%. |
| Announced | +23.0 | Not yet under construction |
| Total on completion | 507.3 | Rise of 15.0% on operating capacity |
2. Demand Trajectory to 2050
Read the 230% rise as demand reaches 3.3 times its current level by 2050. That compounds at approximately 4.9% per year over 25 years and adds approximately 27% to demand over five years, compared with 15% added to capacity if the full pipeline completes. The comparison is indicative because utilisation varies by market. It still shows why sub-Saharan markets without spare capacity carry the price risk.
3. Heat Balance: What the Kiln Route Costs
A worked example makes the kiln penalty concrete. Take a 3 Mt cement plant with a clinker factor of 0.75 (2.25 Mt of clinker), a PH-PC baseline of 3.4 GJ per tonne of clinker and coal at 25 GJ per tonne.
Table: Illustrative Annual Fuel Demand for a 3 Mt Cement Plant by Kiln Route
| Kiln route | GJ per tonne of clinker | Fuel demand (PJ) | Coal equivalent (tonnes) |
| Dry, PH-PC | 3.40 | 7.65 | 306,000 |
| Long dry (+33%) | 4.52 | 10.17 | 407,000 |
| Old wet (+85%) | 6.29 | 14.15 | 566,000 |
The wet route burns 260,000 tonnes more coal a year than the PH-PC route. At an assumed USD 100 per tonne delivered, that penalty costs approximately USD 26 million a year. On the PH-PC base, 40% thermal substitution avoids approximately 122,000 tonnes of coal, and 70% avoids approximately 214,000 tonnes of coal, before adjusting for the lower calorific value of waste fuels.
4. Trade Flows and Clinker Logic
Trade volumes show who holds the export advantage. Egypt ships approximately 20 Mt a year, about 14 times Nigeria’s 1.4 Mt, while Algeria’s GICA exported 6 Mt in 2023 and South Africa imported 1.49 Mt in 2025. Clinker flows to markets with grinding capacity, but no kilns, and exporters with deep-water bulk terminals win those flows. Egypt’s USD 18-per-tonne price gap relative to Vietnam puts a number on the missing port infrastructure.
5. Risks That Can Break the Thesis
Table: Principal Risks to the Cement Industry in Africa
| Risk | Evidence | Exposure |
| Overcapacity | South Africa has approximately 60% utilisation | Price pressure as new lines open |
| Currency and fuel imports | Egypt’s dollar shortage from 2023; imported coal and spares across West and East Africa | Margin swings that outrun price increases |
| Market concentration | Nigeria’s regulator investigating pricing; Morocco’s proposed overhaul | Price caps and forced remedies |
| Trade policy | Egypt’s 30% export cap; South Africa’s anti-dumping efforts | Lost export volume or contested imports |
| Carbon cost | South African carbon tax paid by local producers, not importers | Competitive disadvantage for compliant plants |
Overcapacity and currency losses cause most failures in this industry, and the two feed each other: a plant that cannot sell volume cannot service dollar costs. Producers with low fuel bills, port access, and export options survive both.
Conclusion: Energy Control Decides Africa’s Cement Winners
The cement industry in Africa has the demand case, the capital, and the construction pipeline. Many markets still lack cheap, reliable energy, and that gap decides the winners. A 3 Mt plant on an old wet route burns 260,000 tonnes more coal a year than a modern PH-PC line, while a PH-PC plant at 70% alternative fuel substitution avoids 214,000 tonnes. Those tonnes, not announced capacity, set the margin when prices fall.
Cement industry growth in Africa will continue, but it will reward fewer producers than the pipeline suggests. Among African cement manufacturers, Dangote, Huaxin, and Heidelberg Materials already have the scale and balance sheets, and the cement industry outlook in Africa favours them. The next tier belongs to national champions that secure gas or waste fuel, build export terminals, and defend their grade premium at home. Investors should back plants that control energy cost first and plants that add the most capacity second.
Go Deeper Into Africa’s Cement Industry
Explore more cement market analysis, manufacturing insights, capacity trends, and industry developments on Construction Frontier: Cement & Concrete, covering the forces shaping production, investment, pricing, and demand across Africa. Follow the data and strategies driving the continent’s rapidly expanding cement industry.